How a Global Solar Manufacturer Unified 200+ Plant Sites into One AI-Powered Analytics Platform | LeanQubit.ai
SHARE
How a Global Solar Manufacturer Unified 200+ Plant Sites into One AI-Powered Analytics Platform
A major solar panel manufacturer and operator with a worldwide portfolio partnered with LeanQubit to unify heterogeneous data from 200+ utility-scale sites into a single cloud-native platform — enabling predictive maintenance, real-time performance monitoring, and fleet-wide efficiency gains.
T
Team LeanQubitWriter
12 min read
TL
Team LeanQubit
Writer
Written by Team LeanQubit, Writer at LeanQubit.ai.
Share
Ready to Transform
Optimize your manufacturing with AI.
Discover how LeanQubit's solutions can reduce downtime and improve quality on your production line.
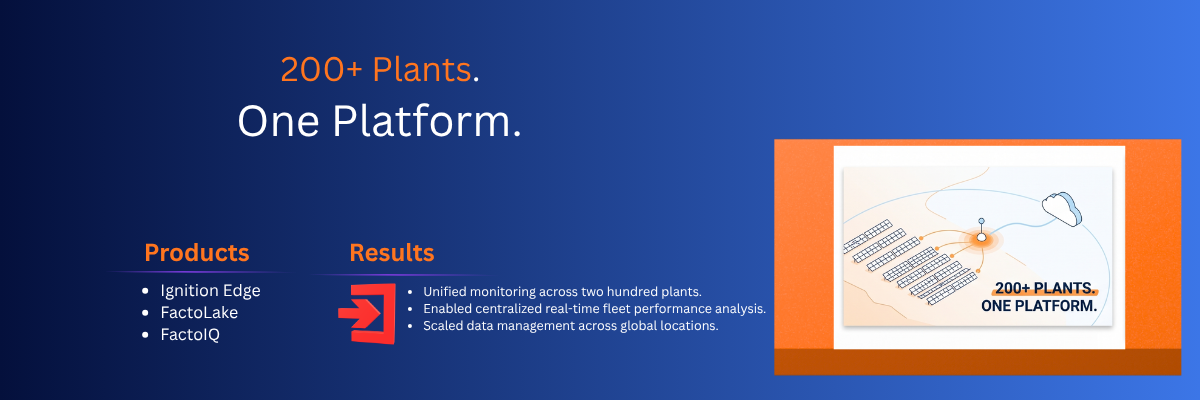
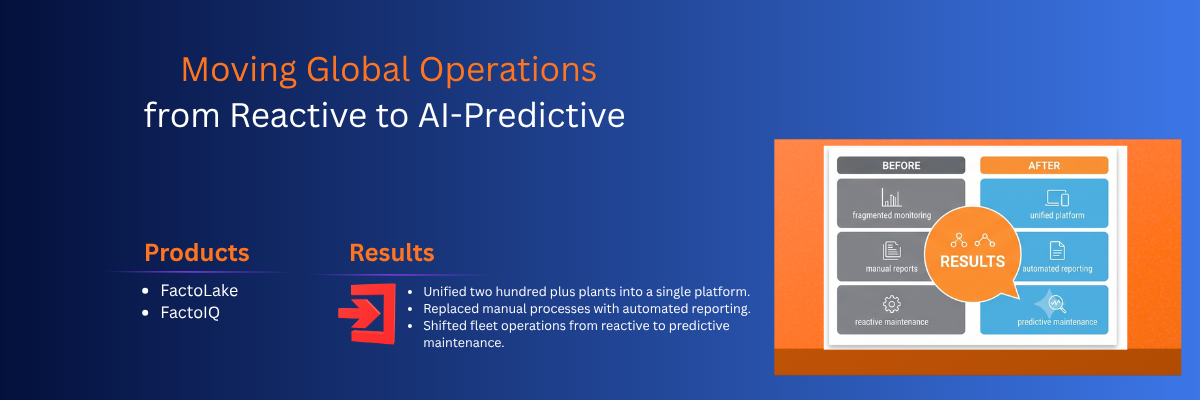
200+ utility-scale solar plants across multiple continents were unified into a single, cloud-native analytics platform — replacing fragmented, vendor-specific monitoring systems that couldn't communicate with each other.
FactoLake centralised both time-series and structured data from heterogeneous equipment (inverters, meters, weather stations) into one query-ready repository — enabling cross-fleet performance comparison for the first time.
FactoIQ's predictive analytics layer detected degradation patterns and triggered maintenance alerts before failures caused unplanned outages — shifting the operations team from reactive to predictive across the entire global fleet.
The Client
A major global solar panel manufacturer and plant operator managing a portfolio of over 200 utility-scale solar installations across multiple continents. The fleet included equipment from dozens of different vendors — inverters, string combiners, weather stations, and metering systems — each generating data in proprietary formats and protocols.
The company’s operations team was responsible for maximising energy yield, minimising unplanned downtime, and maintaining equipment health across the entire fleet — from a central operations centre thousands of kilometres from most sites.
The Problem: Data Existed Everywhere but Was Usable Nowhere
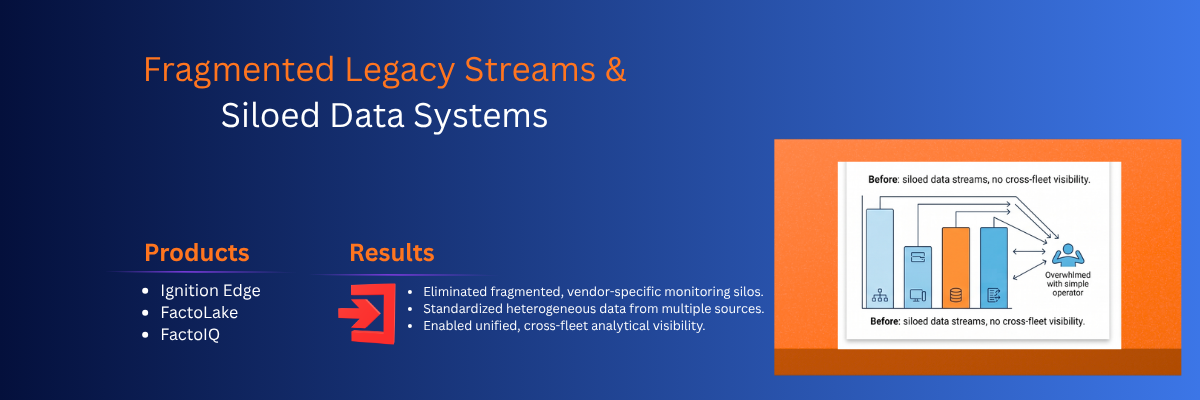
The fundamental challenge wasn’t a lack of data. Every solar site was generating thousands of data points per minute — inverter performance, panel degradation metrics, weather conditions, grid export figures, alarm logs. The problem was that this data was fragmented across sites, trapped in vendor-specific formats, and inaccessible for cross-fleet analysis.
Challenge 1: Heterogeneous Data Streams Across 200+ Sites
Each solar site used equipment from different vendors, each with its own communication protocols, data formats, and monitoring interfaces. Inverter data from Manufacturer A looked nothing like inverter data from Manufacturer B — different tag names, different units, different data structures. Weather stations used different protocols again. Metering systems had their own formats.
The result: the operations team had 200+ separate monitoring interfaces, each showing one site’s data in one vendor’s format. Comparing performance across sites — which is the core requirement for identifying underperforming assets in a fleet — was practically impossible without days of manual data compilation.
Challenge 2: Manual Reporting and Delayed Issue Detection
Performance reports were compiled manually — operations engineers downloaded data from individual site monitoring portals, compiled spreadsheets, and produced weekly performance summaries. By the time a degradation trend or equipment issue was identified in a report, it had often been developing for days or weeks.
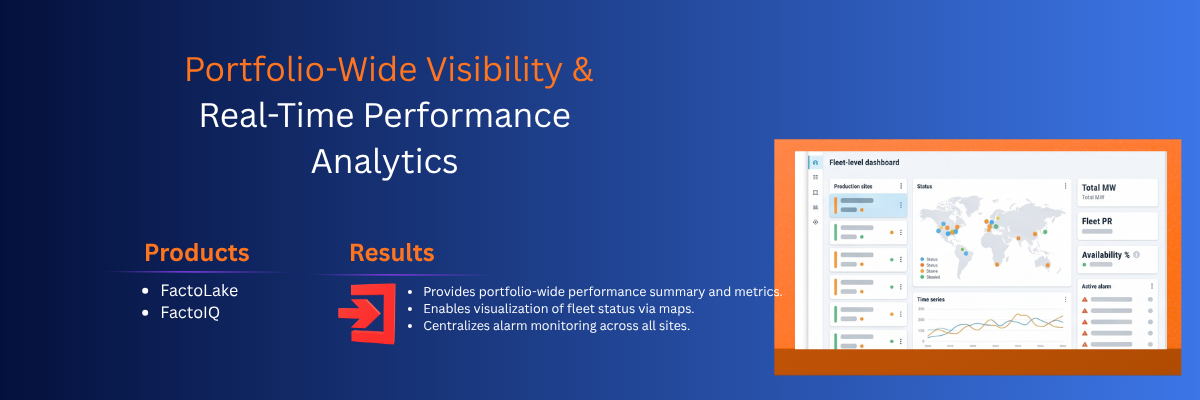
Alarm management was equally fragmented. Each site’s monitoring system generated its own alarms, routed through different channels, with different severity classifications. There was no centralised alarm triage — the operations team couldn’t see, at a glance, which sites across the entire fleet needed attention and in what priority order.
Challenge 3: No Centralised Analytics for Fleet Optimisation
The most valuable analytical capability for a solar fleet operator — comparing performance across sites to identify systematic underperformance, equipment-specific degradation patterns, and environmental correlations — was unavailable. Data was siloed by site and by vendor. Cross-fleet analytics required a unified data platform that didn’t exist.
Challenge 4: Scaling Infrastructure for Global Operations
Any solution needed to handle the data volume of 200+ sites generating high-frequency time-series data continuously — securely, reliably, and without creating a single point of failure. The architecture needed to work across continents, accommodate sites with varying connectivity quality, and scale as new sites were added to the portfolio.
Scale of the data challenge
A single utility-scale solar plant generates approximately 50,000–200,000 data points per day from inverters, weather stations, meters, and auxiliary equipment. Across 200+ sites, the platform needed to ingest, store, and analyse 10–40 million data points daily — continuously, with sub-minute latency for real-time monitoring, and with years of historical retention for trend analysis and predictive modelling.
The Solution: Ignition Edge + FactoLake + FactoIQ
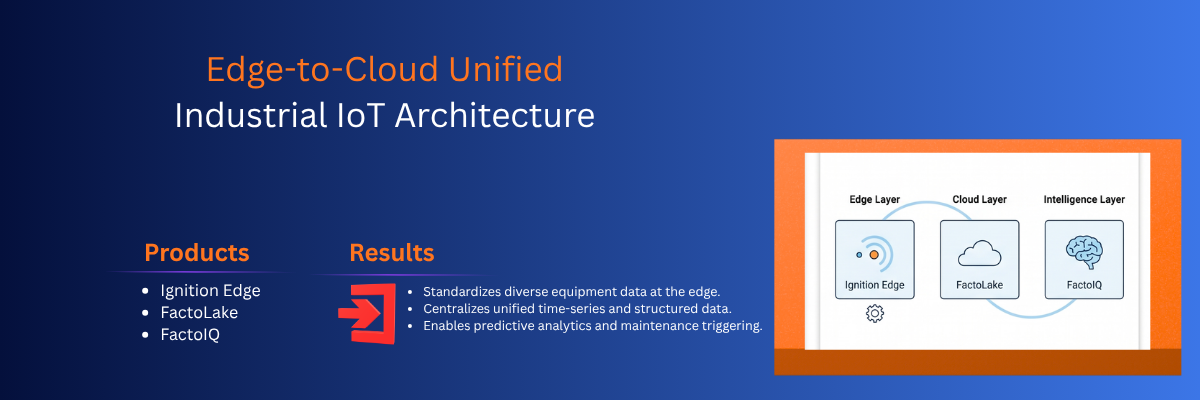
LeanQubit deployed a three-layer architecture designed for global-scale solar fleet analytics:
Layer 1: Ignition Edge at Every Site — Standardised Data Acquisition
At each solar installation, an Ignition Edge gateway was deployed as the on-site data acquisition layer. Ignition Edge connected to all on-site equipment — inverters (regardless of vendor), weather stations, revenue meters, grid interconnection equipment — via their native protocols (Modbus, SunSpec, proprietary APIs) and standardised the data into a consistent format before transmission to the cloud.
This standardisation at the edge was critical. By normalising data at the source, every site’s data arrived at the central platform in the same structure — regardless of which vendor’s equipment was installed. An inverter metric from a site in India looked identical in format to the same metric from a site in Europe.
Site data flowed from Ignition Edge gateways into Azure EventHub — Microsoft’s cloud-native event streaming service — providing secure, high-throughput data ingestion that scaled automatically with the number of sites.
From EventHub, data was processed and stored in FactoLake — LeanQubit’s unified industrial data platform. FactoLake served as the central repository for all fleet data, unifying both time-series data (inverter performance, weather measurements, energy production at sub-minute resolution) and structured/relational data (site configurations, equipment registries, maintenance records, warranty information) into a single, query-ready model.
The unification step was where FactoLake’s industrial data expertise mattered most. Solar fleet data isn’t just time-series — it’s time-series with context. An inverter producing 85% of its rated capacity means something very different depending on the irradiance level, the panel age, the ambient temperature, and the string configuration. FactoLake maintained all of these contextual relationships, enabling the analytics layer above it to generate contextually accurate insights rather than misleading raw comparisons.
Layer 3: FactoIQ Analytics Platform — Intelligence and Prediction
FactoIQ sat above FactoLake as the analytics and intelligence engine, providing four categories of analytical capability:
Performance monitoring: Continuous calculation of site-level and fleet-level KPIs — Performance Ratio (PR), Specific Yield, Availability, Capacity Factor — against weather-normalised benchmarks. Sites underperforming their weather-adjusted benchmark were automatically flagged for investigation.
Degradation detection: Long-term trend analysis on inverter-level and string-level performance data to detect panel degradation, soiling patterns, and equipment aging at rates above expected trajectories. Early detection of above-average degradation enabled targeted cleaning schedules, warranty claims, and panel replacement prioritisation.
Predictive maintenance triggers: Pattern recognition on equipment health signals — inverter temperature profiles, DC/AC conversion efficiency trends, fault code frequency patterns — to predict equipment failures before they caused unplanned outages. Predictive alerts were generated with enough lead time to schedule maintenance during low-production periods (cloudy days, scheduled curtailment windows).
Root-cause diagnosis: When performance deviations were detected, FactoIQ’s correlation engine automatically identified the most probable cause — distinguishing between equipment faults, soiling, shading events, grid curtailment, weather-driven losses, and inverter clipping — without requiring manual investigation for each event.
The degradation detection value
Solar panel degradation is typically 0.5–0.8% per year under normal conditions. Panels degrading at 1.5–2.0% per year represent a significant warranty and financial issue — but the difference between 0.7% and 1.5% degradation is invisible in monthly performance reports. FactoIQ’s trend analysis detected above-average degradation at the string level, months before it would be visible in aggregate site performance — enabling warranty claims and targeted intervention while the issue was still manageable.
Live Dashboards: Central and Site-Level Visibility
The solution included a comprehensive dashboard layer providing two levels of operational visibility:
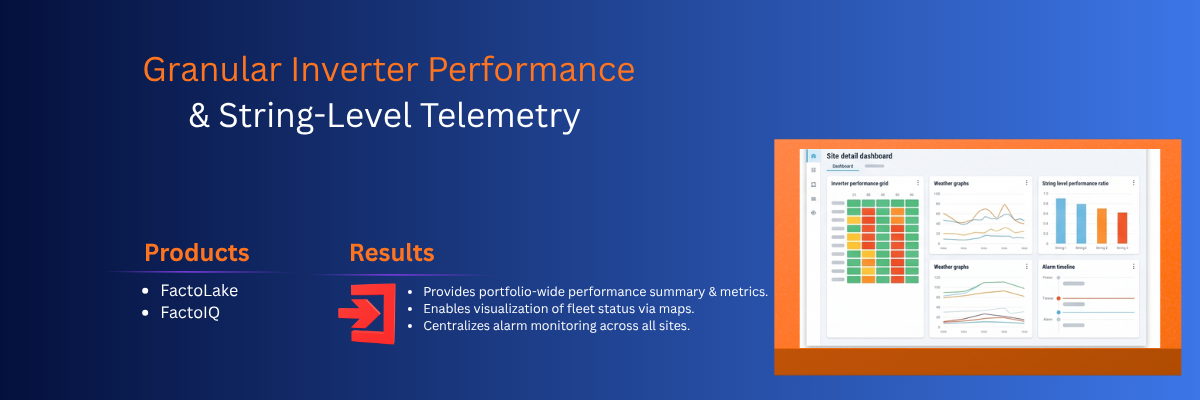
Fleet-level dashboards (central operations centre): Portfolio-wide performance summary, ranked site performance, fleet KPI trends, active alarm summary across all sites, maintenance queue, and weather forecast overlay for production forecasting.
Site-level dashboards (site managers and O&M teams): Detailed inverter-level performance, string-level health indicators, environmental data, alarm history, maintenance schedule, and site-specific trend analysis.
Implementation: From Fragmented to Unified in Phases
Phase 1: Pilot deployment (3 sites, 8 weeks)
Three representative sites — different geographies, different equipment vendors, different sizes — were selected for the pilot. Ignition Edge was deployed at each, connected to all on-site equipment, and data flow into FactoLake was established.
The pilot validated three critical assumptions: that Ignition Edge could connect to all vendor equipment via existing protocols (it could), that FactoLake’s data model could accommodate the structural variation across sites (it did), and that FactoIQ’s analytics could generate meaningful insights from the unified data within weeks (it produced its first degradation detection finding in Week 4).
Phase 2: Fleet rollout (200+ sites, 6 months)
Following pilot validation, the Ignition Edge deployment was rolled out across the remaining portfolio in batches of 20-30 sites, prioritised by site size and strategic importance. The standardised deployment process — refined during the pilot — enabled each batch to go live within 2-3 weeks of starting.
FactoLake and FactoIQ scaling was handled by the Azure cloud infrastructure — no capacity planning or hardware procurement was required as the number of connected sites grew.
Phase 3: Predictive model maturation (ongoing)
With 6+ months of unified fleet data in FactoLake, FactoIQ’s predictive models reached production-grade accuracy — generating actionable maintenance predictions and degradation alerts across the fleet. Model performance improved continuously as more operational data accumulated.
Results and Impact
Verified outcomes
The following results were measured across the client’s global solar portfolio following full platform deployment.
Operational outcomes
200+ plants remotely monitored and managed via a single platform — replacing the fragmented, vendor-specific monitoring approach that required the operations team to maintain separate access to dozens of different portals.
Significant reduction in unplanned outages and response time — predictive maintenance alerts from FactoIQ enabled the O&M teams to schedule interventions before equipment failures caused production losses. The operations team reported that the average time from issue detection to maintenance dispatch dropped from days (manual discovery in weekly reports) to hours (automated alert with priority classification).
Fleet-wide efficiency gains through trend-based recommendations — FactoIQ’s cross-fleet analysis identified systematic underperformance patterns that were invisible at the individual site level. Examples included: a specific inverter firmware version consistently underperforming across multiple sites (enabling a targeted firmware update campaign), and a soiling pattern correlated with regional weather that informed optimised cleaning schedules.
Automated, actionable reporting — weekly and monthly performance reports that previously required 2-3 days of manual data compilation per reporting cycle were automated entirely. Operations leadership received dashboard-driven reports with drill-down capability, replacing static spreadsheet attachments.
Strategic outcomes
Foundation for machine learning integration — the unified, clean data layer in FactoLake created the prerequisite for advanced ML applications that were previously impossible with fragmented data: production forecasting, automated anomaly classification, and digital twin models for simulation and planning.
Scalable architecture for portfolio growth — new site acquisitions are onboarded to the platform within 2-3 weeks using the standardised Ignition Edge deployment process. The marginal cost and effort of adding each new site decreased as deployment processes matured.
Data-driven asset management decisions — fleet-wide performance data enabled informed decisions about equipment replacement timing, warranty claims, panel cleaning ROI, and O&M contract renegotiation — decisions that were previously based on incomplete or site-specific data.
Why This Approach Worked: The Technical Decisions That Mattered
Edge standardisation solved the vendor fragmentation problem
The decision to standardise data at the edge (via Ignition Edge) rather than at the cloud layer meant that every site’s data arrived at FactoLake in a consistent format, regardless of the original equipment vendor. This architectural choice eliminated the combinatorial complexity of building and maintaining cloud-side connectors for every vendor-protocol combination across 200+ sites.
By using Azure EventHub for data ingestion and cloud-native storage for FactoLake, the platform scaled automatically with the portfolio — no capacity planning required when new sites were added. This elasticity was essential for a fleet operator adding new sites quarterly through acquisition and construction.
Unified time-series and relational data in FactoLake
Most IoT platforms handle time-series data well but relational data poorly (or vice versa). Solar fleet analytics requires both — time-series for performance monitoring and relational data for equipment configuration, maintenance history, and site characteristics. FactoLake’s ability to unify both data types in one queryable model was the foundation that made FactoIQ’s contextual analytics possible.
What’s Next: The Roadmap
The client’s roadmap with LeanQubit includes:
Advanced ML-driven production forecasting — using historical performance data, weather forecasts, and panel degradation models to predict next-day and next-week energy production with higher accuracy than current methods.
Automated warranty claim generation — when FactoIQ detects above-warranty degradation rates at the string or panel level, automatically generating warranty claim documentation with the supporting performance data.
Digital twin modelling — building simulation models of high-value sites that enable scenario analysis for repowering decisions, technology upgrades, and layout optimisation.
Frequently Asked Questions
The pilot (3 sites) took 8 weeks. Full fleet rollout (200+ sites) was completed in approximately 6 months, deploying in batches of 20-30 sites. Each batch took 2-3 weeks from start to live monitoring. The total timeline from project initiation to full fleet coverage was approximately 8 months.
Yes — Ignition Edge connects to inverters via standard industrial protocols (Modbus TCP, SunSpec, proprietary APIs where available). The solution has been deployed across sites with inverters from all major manufacturers. Adding support for a new inverter brand requires protocol configuration in Ignition Edge, not platform development.
Ignition Edge buffers data locally at the site during connectivity interruptions and automatically synchronises with FactoLake when connectivity is restored. No data is lost during outages — the local buffer retains up to 30 days of data depending on configuration. Real-time monitoring is interrupted during the outage, but historical data is complete.
The architecture — edge standardisation, cloud data unification, analytics layer — is asset-agnostic. FactoLake and FactoIQ are designed for industrial data from any equipment type. Wind turbine monitoring, battery storage analytics, and hybrid plant optimisation are all supported with the same platform, configured for different equipment data models.
Ongoing costs include: FactoLake and FactoIQ platform licensing (per-site or portfolio-level pricing), Azure cloud infrastructure costs (scaling with data volume and retention), Ignition Edge licensing per site, and annual support and model maintenance. Contact LeanQubit for portfolio-specific pricing.