How a High-Mix Manufacturer Unlocked 20–30 Minutes of Hidden Capacity per Shift with FactoIQ | LeanQubit.ai
SHARE
How a High-Mix Manufacturer Unlocked 20–30 Minutes of Hidden Capacity per Shift with FactoIQ
A major manufacturer with thousands of component variations deployed LeanQubit's FactoIQ to replace manual cycle time benchmarks with data-driven standards and predictive downtime sequencing — unlocking 20–30 minutes of free production capacity every shift without any equipment or staffing changes."
T
Team LeanQubitWriter
5 min read
TL
Team LeanQubit
Writer
Written by Team LeanQubit, Writer at LeanQubit.ai.
Share
Ready to Transform
Optimize your manufacturing with AI.
Discover how LeanQubit's solutions can reduce downtime and improve quality on your production line.
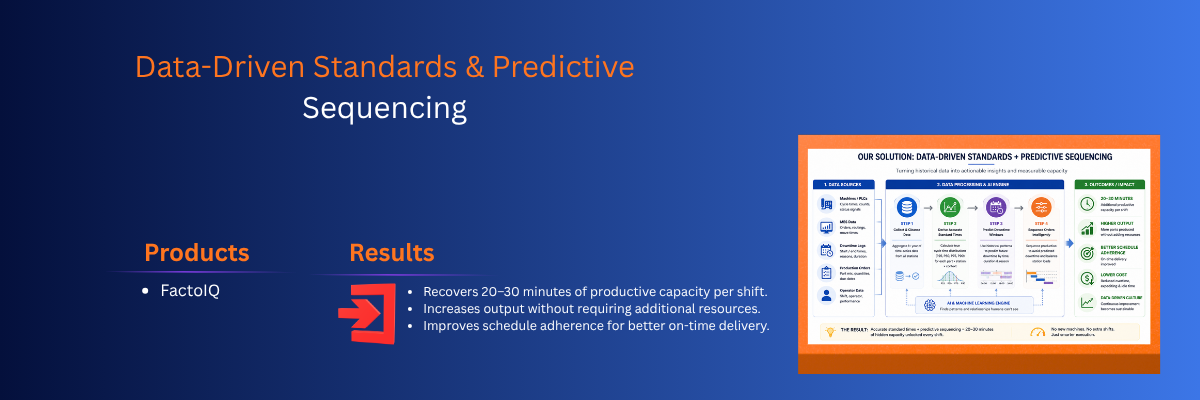
Manual cycle time benchmarks — the standard times used for scheduling, costing, and capacity planning — were replaced with data-driven standards derived from one year of actual time-series production data, revealing that the real manufacturing performance differed significantly from assumed standards.
Predictive downtime sequencing used historical downtime patterns to anticipate future downtime windows and sequence production orders around them — proactively managing idle time rather than reacting to it after it occurred.
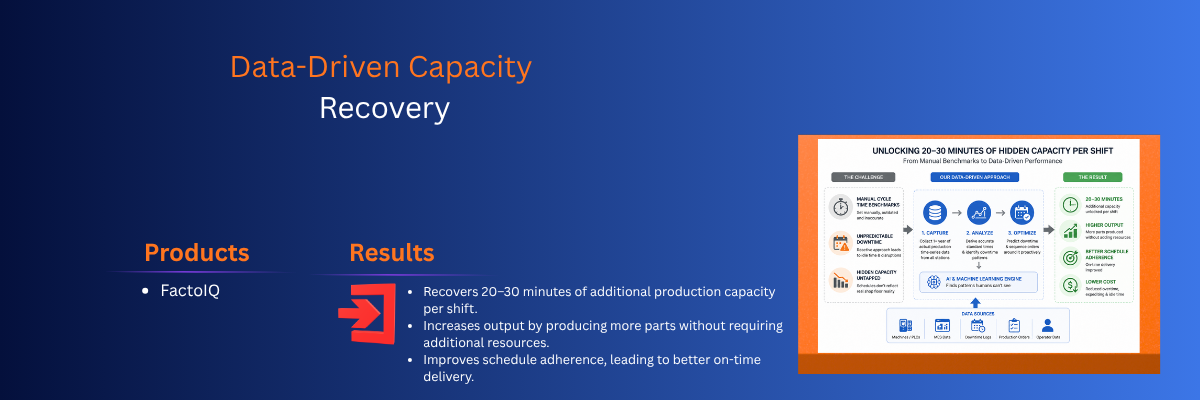
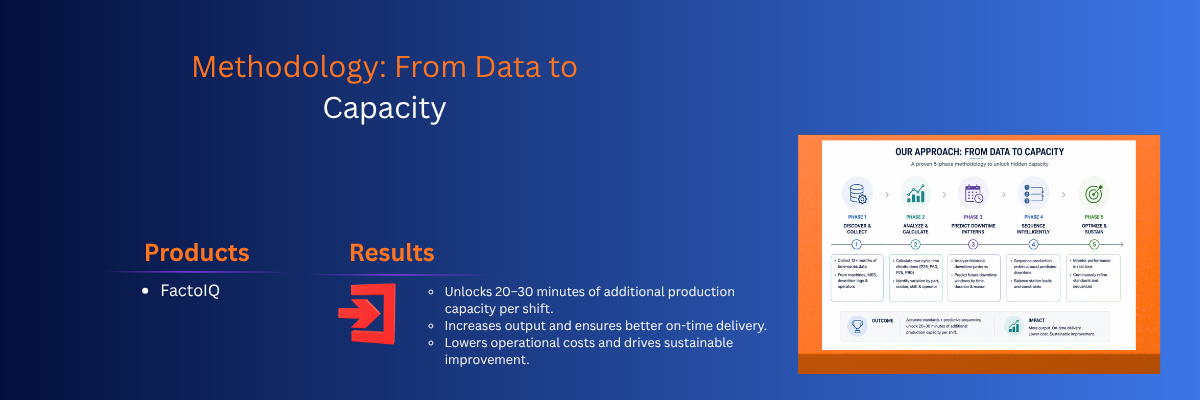
The combination of accurate standard times and predictive sequencing unlocked 20–30 minutes of additional production capacity per shift — without any change to equipment, staffing, or operating hours.
The Client
A major discrete manufacturer producing thousands of different component types in a high-mix production environment. The facility processes hundreds of distinct part numbers daily, each with different processing requirements, routings, and cycle times across multiple production stations.
The high-mix nature of the operation meant that production conditions changed continuously — different parts arriving at different stations in different sequences, with different processing times and different quality requirements. This variability made traditional fixed-schedule optimisation approaches insufficient — the production environment was too dynamic for static planning tools to capture accurately.
The Problem: Standard Times Were Wrong and Everyone Knew It
The core operational challenge was deceptively simple to state: the standard times used for scheduling, capacity planning, and cost accounting were wrong. Not slightly wrong — systematically wrong in ways that compounded across hundreds of parts and dozens of stations every shift.
Challenge 1: Long, Variable Cycle Times That Defied Simple Standards
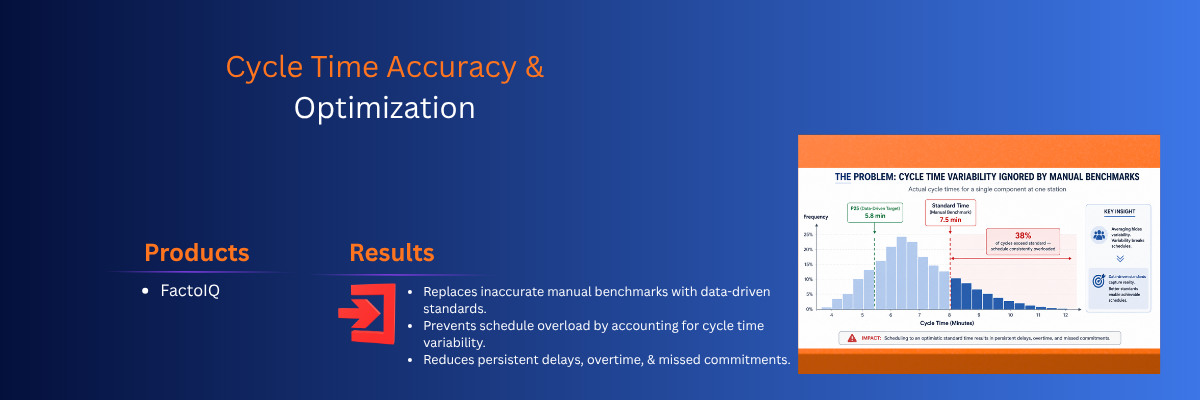
Unlike repetitive manufacturing where each cycle is essentially identical, this high-mix environment produced cycle times that varied significantly depending on the specific component being processed, the particular station doing the processing, the shift and operator performing the work, and the production sequence (what ran before and after).
A single component’s processing time at one station might range from 4 minutes to 11 minutes depending on these contextual factors. A standard time of “7.5 minutes” captured the average but not the distribution — and it was the distribution, not the average, that determined whether the production schedule was achievable.
Challenge 2: Manual Benchmarks Disconnected from Reality
The standard cycle times in the scheduling system had been set manually — either during initial system configuration (sometimes years ago) or through periodic time studies (intermittent observations that captured a snapshot, not the ongoing reality).
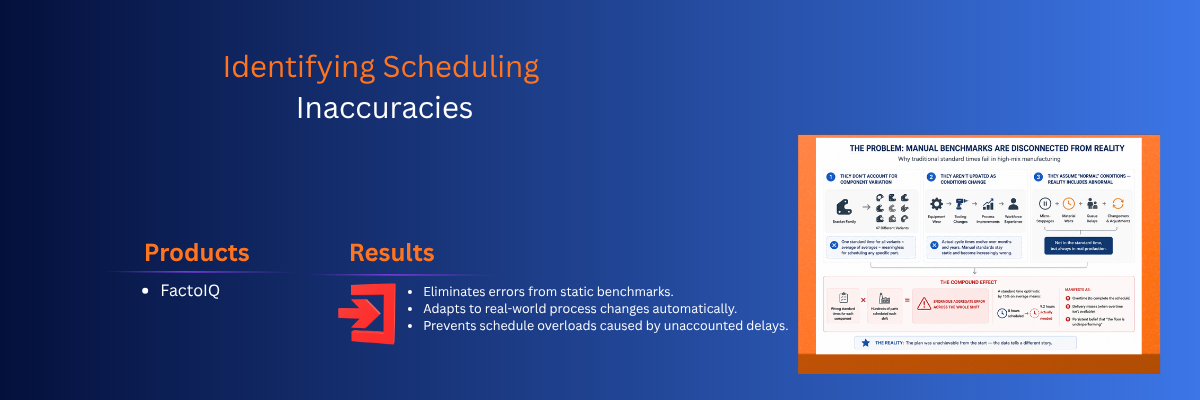
These manual benchmarks had three systematic problems:
They didn’t account for component variation. A “bracket” had one standard time — but the facility produced 47 different bracket variants, each with different processing requirements. The standard time was an average of averages — meaningless for scheduling any specific variant.
They weren’t updated as conditions changed. Equipment wear, tooling changes, process improvements, and workforce experience shifts all altered actual cycle times over months and years. The standard times didn’t move with them.
They were set for “normal” conditions but production included abnormal. Standard times assumed continuous, uninterrupted processing. Real production included micro-stoppages, material waits, queue delays between stations, and partial-shift changeovers — none of which appeared in the standard time but all of which consumed real production time.
The compound effect of wrong standards
When every component’s standard time is wrong by a moderate amount, and hundreds of components are scheduled per shift, the aggregate error is enormous. A standard time that’s optimistic by 15% on average means a shift schedule that promises 8 hours of output but requires 9.2 hours to complete. This 15% gap manifests as: overtime (to complete the schedule), delivery misses (when overtime isn’t available), and a persistent perception that “the floor is underperforming” when in fact the plan was unachievable from the start.
Challenge 3: Complex Component Attributes Affecting Processing and Routing
Each component variant had attributes — material type, dimensions, surface finish requirements, tolerance classes — that affected both processing time and routing. Two components that looked similar to a scheduling system using simplified part-family classifications might require dramatically different processing at certain stations.
The manual scheduling approach couldn’t capture this attribute-driven variability. It grouped components into families and applied family-level standards — missing the within-family variation that drove the most significant scheduling errors.
Downtime events — equipment stops, material waits, quality holds, changeovers — occurred throughout each shift in patterns that were partially predictable (certain machines had regular maintenance windows, certain products had known quality risk points) and partially random (unexpected equipment faults, supply delays).
The scheduling system treated downtime as a fixed availability deduction (e.g., “this machine is available 90% of the time”). The reality was that downtime didn’t occur uniformly across the shift — it clustered at certain times, on certain machines, in certain sequences. These clusters created bottlenecks that were different every day, invisible to the scheduling system, and experienced by the floor as unpredictable idle periods followed by rushed catch-up.
The Solution: FactoIQ — Data-Driven Standards and Predictive Sequencing
FactoIQ was deployed to solve the cycle time accuracy problem from first principles — starting with the raw time-series data rather than assumptions about what cycle times should be.
Step 1: One Year of Time-Series Data Collection and Analysis
FactoIQ collected and analysed one full year of time-series production data — the actual timestamps of every part arriving at every station, every processing start and stop event, every inter-station movement, and every downtime event, for every component variant across all production stations.
This data represented millions of individual cycle time observations, each tagged with the specific component variant, station, shift, operator, preceding and following component (for sequence effects), and any downtime events that occurred during or adjacent to the processing cycle.
The analysis computed:
Per-component, per-station distributions: Not just averages — full statistical distributions (quartiles, standard deviations, percentiles) of processing time and wait time for every component-variation-station combination. These distributions revealed the true performance envelope for each processing step.
Arrival and departure patterns: When components actually arrived at each station (versus when the schedule said they should arrive), and how arrival variability propagated downstream through the production process.
Wait time analysis: The time components spent in queue at each station — waiting for the machine to become available after the previous part, waiting for an operator, waiting for tooling — separated from actual processing time. Wait time is pure waste; but in the old system, it was invisible because it was lumped into the “cycle time” measurement.
Shift and temporal effects: How cycle times varied by shift, by day of week, by time within the shift (start-of-shift warmup effects, end-of-shift fatigue effects), and by season (temperature effects on materials and equipment).
Step 2: Data-Driven Standard Times for Every Component and Variation
The first output of FactoIQ’s analysis was a complete set of data-driven standard times — one for every component-variation-station combination, based on actual production performance rather than manual benchmarks.
These standards were fundamentally different from the old manual benchmarks in three ways:
Variation-specific: Instead of one standard for “brackets,” there were specific standards for each of the 47 bracket variants — reflecting the actual processing time differences that the manual benchmarks had averaged away.
Statistically grounded: Each standard time was derived from hundreds or thousands of actual observations, with known confidence intervals. The system knew not just that “Bracket Variant 17 takes 6.2 minutes on Station 4” but that “95% of Bracket Variant 17 cycles on Station 4 complete between 5.1 and 7.8 minutes” — providing the scheduler with both the expected value and the uncertainty range.
Continuously updated: Unlike manual benchmarks that were set once and drifted, FactoIQ’s standards updated continuously as new production data accumulated — automatically adjusting as processes changed, equipment aged, and workforce experience evolved.
Step 3: Predictive Downtime Sequencing
The second output — and the more operationally impactful one — was predictive downtime sequencing: using historical downtime patterns to anticipate when and where downtime would occur in future shifts, and optimising the production sequence to work around predicted downtime rather than being disrupted by it.
How predictive downtime sequencing works:
FactoIQ analysed the historical downtime data for each machine across the full year of observations. Some downtime was random and unpredictable. But a significant fraction followed patterns:
Certain machines had higher downtime probability at specific times of day (thermal expansion effects causing jams in the first hour of the shift, for example)
Certain product sequences were more likely to trigger downtime (a heavy-duty component followed by a precision component on the same machine created a setup stress that occasionally caused faults)
Certain maintenance cycles produced predictable post-maintenance settling periods with elevated fault rates
FactoIQ modelled these patterns and generated downtime probability forecasts for each machine for each upcoming shift — not as certainties (“Machine 7 will go down at 10:30”) but as probability windows (“Machine 7 has a 35% elevated downtime probability between 10:00 and 11:00 based on historical patterns for this day-of-week and product sequence”).
The production sequencing engine used these probability windows to schedule the most critical, tightest-deadline orders during low-probability periods, and less time-sensitive work during high-probability windows — so that if downtime did occur, it disrupted the least critical production rather than the most.
Step 4: Continuous Feedback Loop
FactoIQ’s cycle time optimisation is not a one-time analysis — it’s a continuous system. Every production cycle adds a new data point to the statistical model. Every downtime event refines the downtime prediction model. Every shift produces new evidence for or against the current standard times.
This continuous learning means the system’s accuracy improves over time. The standards get tighter. The downtime predictions get more precise. The sequencing gets more effective. The capacity gains compound.
The continuous learning advantage
Most manufacturing improvement projects produce a one-time benefit that degrades over time as conditions change. FactoIQ’s continuous learning approach produces an improving benefit over time — each month’s production data makes the next month’s standards more accurate and the next month’s sequencing more effective. The 20-30 minute capacity recovery measured in the initial deployment represents the starting point, not the ceiling.
Results and Impact
Quantified outcomes — measured post-deployment
20–30 minutes of free production capacity recovered per shift — without any change to equipment, staffing, or operating hours. This capacity was “hidden” in the gap between manual standard times (which overestimated some operations and underestimated others) and actual processing capability, and in the downtime-driven idle periods that predictive sequencing eliminated.
To contextualise this number: 20-30 minutes per shift, across 2-3 shifts per day, across 250 working days per year, represents 166-375 additional production hours annually — equivalent to adding 21-47 full shifts of production capacity per year from the existing equipment base.
Thousands of components sequenced for optimal flow — FactoIQ’s sequencing engine optimised the flow of thousands of parts per shift, factoring in both data-driven cycle times and predicted downtime windows. The sequencing quality — measured by total idle time between operations and critical-path order completion timing — improved measurably versus the manual sequencing baseline.
Cycle time and downtime now continuously tracked and benchmarked — for the first time, the facility has a living, updating picture of actual production performance at the component-variant-station level. Deviations from established baselines are automatically flagged. New component introductions automatically build performance baselines from the first production runs.
Standard time accuracy dramatically improved — the gap between scheduled production hours and actual production hours (the planning-actuals variance) narrowed significantly. Schedules became achievable, reducing the chronic overtime that had been a symptom of over-optimistic manual standards.
Operational improvements beyond capacity recovery
Planners and supervisors now work with real metrics — real cycle times and real downtime data replaced the estimated benchmarks and anecdotal downtime reporting that had informed decisions before. The quality of operational decision-making improved because the input data improved — a simple but significant upgrade.
More predictable workflow — the combination of accurate scheduling (from data-driven standards) and proactive downtime management (from predictive sequencing) made the production floor more predictable. Operators experienced fewer unexpected interruptions, supervisors spent less time firefighting, and the shift’s production trajectory was visible from the first hour rather than uncertain until the end.
Reduced variability in output — shift-to-shift variation in total output decreased. The standard deviation of daily production quantity narrowed because the scheduling was more consistently achievable and the downtime management was more consistently effective.
Scalable methodology — the FactoIQ analysis and optimisation framework extends naturally as new component types are introduced or process changes are implemented. New components build performance baselines from their first production runs. Process changes are reflected in updated standards within weeks as new data accumulates.
What Made This Work: The Technical Insight
The core technical insight behind FactoIQ’s cycle time optimisation is that cycle time variation in high-mix manufacturing is not random noise to be averaged away — it’s signal that contains information about the manufacturing process. When a component’s cycle time varies from 4 to 11 minutes, the specific factors that drive it toward 4 (optimal conditions, experienced operator, well-maintained tooling, favourable sequence position) and toward 11 (suboptimal conditions, unfamiliar variant, worn tooling, post-downtime restart) are identifiable from historical data.
FactoIQ’s statistical models capture these factors. The standard time isn’t “7.5 minutes” — it’s “5.1-5.8 minutes under conditions A (which can be created by scheduling appropriately), 6.5-7.8 minutes under conditions B (the normal case), and 9-11 minutes under conditions C (which should be avoided by sequencing away from known risk factors).”
This condition-aware standard time model is what makes the sequencing optimisation possible. The scheduler doesn’t just assign work to machines — it assigns work to machines in sequences that create Condition A (short cycle) rather than Condition C (long cycle), and avoids sequences that create elevated downtime probability.
What’s Next: The Optimisation Roadmap
The client’s roadmap with LeanQubit builds on the FactoIQ foundation:
Real-time schedule adjustment during the shift: Currently, the optimised sequence is generated before the shift starts. The next phase integrates real-time production actuals (from FactoMES) into the FactoIQ sequencing engine — enabling mid-shift rescheduling when actual production diverges from the planned sequence. If a downtime event occurs earlier than predicted, the remaining sequence adjusts automatically.
Expansion to additional production lines and sites: The FactoIQ analysis and optimisation methodology is being extended to additional production areas within the facility, and the company is evaluating deployment at its second manufacturing site.
Dashboards for ongoing monitoring and continuous improvement: Permanent dashboards for cycle time trend monitoring, downtime pattern tracking, and standard time accuracy assessment — enabling production engineering and continuous improvement teams to drive systematic performance improvement using FactoIQ data rather than periodic time studies.
Integration with MaintIQ for equipment-health-aware sequencing: Combining FactoIQ’s production sequencing with MaintIQ’s equipment health predictions — so that machines showing early degradation signals are given lighter loads or less critical work, while machines in good health carry the highest-priority orders.
Frequently Asked Questions
The time-series data collection phase used one year of historical data already available in the facility’s production systems — no new data collection period was required. FactoIQ’s analysis of this historical data produced data-driven standards and the first version of the predictive sequencing model within 6-8 weeks of project start. Capacity improvements were measurable from the first week of production running on the FactoIQ-optimised sequence. The 20-30 minute recovery stabilised within the first month of operation.
FactoIQ works with existing production data — time-stamped records of part arrivals, processing starts and stops, and station states. If this data exists in your SCADA historian, MES, or production tracking system, FactoIQ can analyse it. For this deployment, one year of historical data was available from the existing production tracking system — no new sensors or data infrastructure were required.
When a new component is introduced, FactoIQ assigns an initial standard time based on the component’s attributes (dimensions, material, processing requirements) and the performance of similar components in the historical database. This attribute-based estimation provides a reasonable starting standard from Day 1. As actual production data for the new component accumulates (typically 50-100 production cycles), FactoIQ transitions to data-driven standards specific to that component. The transition is automatic and continuous.
Minimal. The continuous learning loop is automatic — new production data feeds the models without manual intervention. Standard times update automatically. Downtime prediction models refine automatically. The primary ongoing effort is reviewing and acting on FactoIQ’s recommendations — which is the same effort that production management was already spending on scheduling decisions, now with better information.
Yes — FactoIQ can provide data-driven standards and sequencing recommendations that are implemented through your existing scheduling system (whether that’s a spreadsheet, an APS, or an ERP scheduling module). Alternatively, FactoIQ integrates natively with FactoPlan for end-to-end optimised scheduling that combines data-driven standards with constraint-aware finite capacity scheduling.