How a Leading Furniture Manufacturer Cut Setup Time by 80% and Went Fully Paperless with FactoMES | LeanQubit.ai
SHARE
How a Leading Furniture Manufacturer Cut Setup Time by 80% and Went Fully Paperless with FactoMES
A large furniture producer with 5 production lines and 100+ stations eliminated paper-based workflows, reduced changeover time from 30 minutes to under 5, and achieved 100% real-time downtime reporting — by deploying LeanQubit's FactoMES with automated recipe management and AI-driven scheduling via
T
Team LeanQubitWriter
16 min read
TL
Team LeanQubit
Writer
Written by Team LeanQubit, Writer at LeanQubit.ai.
Share
Ready to Transform
Optimize your manufacturing with AI.
Discover how LeanQubit's solutions can reduce downtime and improve quality on your production line.
Setup and changeover time was cut from over 30 minutes to under 5 minutes per event — an 80% reduction — by automating machine parameter downloads via FactoMES's recipe management system, eliminating the manual re-entry of setup values that was the primary source of both delay and error.
FactoPlan's AI-powered finite capacity scheduler replaced manual spreadsheet-based scheduling of 3,500+ order lines across 200+ machines — generating optimised production sequences in minutes instead of hours while accounting for machine availability, labour skills, changeover times, and order priorities.
The entire shop floor went paperless — all work orders, downtime records, quality counts, and deviation logs are now digital, captured in real time at the point of occurrence, and visible to supervisors and planners immediately rather than at end of shift.
The Client
A leading furniture manufacturer operating a single large production facility with 5 production lines and over 100 production stations. The company produces a diverse range of furniture products — a make-to-order, high-mix environment where hundreds of different product variants flow through shared production resources daily.
The facility’s production complexity was significant: 200+ machines, hundreds of component variations, frequent changeovers between product types, and a production schedule that changed daily based on customer orders, material availability, and capacity constraints.
The Problem: Manual Processes Choking a High-Mix Operation
The furniture manufacturer’s operational challenges were rooted in the gap between the complexity of their production environment and the simplicity of their management tools. A high-mix, make-to-order facility with 200+ machines and hundreds of daily changeovers was being managed with paper forms, manual data entry, and spreadsheet-based scheduling — tools that might have been adequate for a simpler operation but were visibly holding this one back.
Challenge 1: Manual Order Management — Paper Everywhere
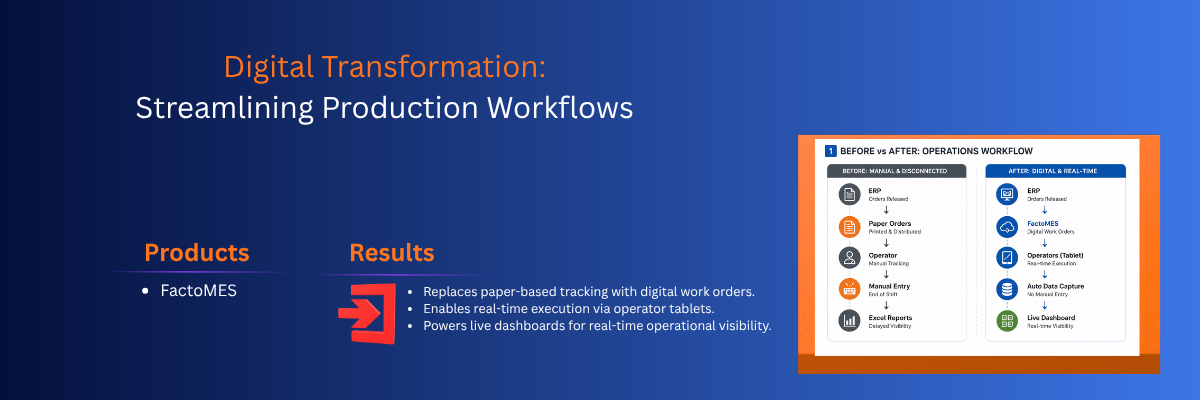
Production order management was paper-based. Work orders were printed from ERP, physically distributed to production stations, manually tracked through each operation, and confirmed back to ERP via end-of-shift data entry. The cycle from order release to ERP confirmation took hours longer than the actual production time because of the administrative overhead.
Paper routing sheets got lost between stations. Handwritten completions were sometimes illegible. End-of-shift data entry meant that production actuals were 4-8 hours old by the time they appeared in ERP — during which time planners were making scheduling decisions based on yesterday’s data.
The order management cycle time — from ERP release to ERP confirmation — was significantly longer than production time alone would warrant, with administrative overhead consuming a substantial fraction of the total.
Challenge 2: Setup Delays — 30+ Minutes Lost at Every Changeover
In a high-mix furniture manufacturing environment, changeovers between product types happen frequently — sometimes dozens of times per shift. Each changeover required operators to manually re-enter machine parameters: cutting dimensions, drilling positions, edge banding specifications, CNC programme numbers, and quality check parameters.
This manual re-entry process took over 30 minutes per changeover event. The time cost was significant — dozens of changeovers per day at 30+ minutes each consumed hours of productive capacity across the facility. But the time cost was only part of the problem.
Manual parameter entry also introduced errors. An incorrect dimension entered during setup meant defective production until the error was caught — sometimes not until quality inspection at the end of the operation, after multiple units had been produced with the wrong setting. The rework and scrap cost from setup errors compounded the time cost significantly.
Challenge 3: No Live Production Schedule — Planners Flying Blind
Production scheduling was managed through spreadsheets. Planners manually sorted 3,500+ order lines across 200+ machines — a process that took hours, was done once at the start of each planning period, and became increasingly inaccurate as the day progressed and reality diverged from the plan.
When a machine went down, when a quality issue held an order, when a rush order arrived from a key customer, the planner had to manually re-sort the spreadsheet and redistribute work — a process that itself took significant time, during which the floor was running against an outdated schedule.
There was no real-time visibility into the current production position. Supervisors knew what was happening at their immediate stations; planners knew what the morning spreadsheet said should be happening; nobody had a real-time view of actual versus planned across the entire facility.
Challenge 4: Quality Counts Not Recorded on the Shop Floor
Quality inspection results — good units, defect counts, defect types — were not recorded at the point of production. Instead, quality data was entered into ERP after the shift, from memory or from handwritten notes that operators maintained alongside their other tasks.
This delayed quality recording had two consequences: operators received no immediate feedback on quality trends during the shift (a gradually worsening defect pattern could persist for hours before anyone noticed), and the quality data that eventually reached ERP was an estimate rather than a measured record.
Challenge 5: Downtime and Deviations Manually Logged — Often Inaccurately
Downtime events were recorded manually on paper logs — if they were recorded at all. Short stoppages (under 10-15 minutes) were frequently not recorded because the time to write down the event approached the duration of the event itself. Longer stoppages were recorded with start and end times that were often estimated, and reason codes that were sometimes too general to be analytically useful (“machine problem” versus a specific fault description).
Deviations — quality issues, process exceptions, material problems — followed a similar pattern: documented when severe enough to warrant stopping production, often undocumented when they were resolved informally by operators.
The hidden cost of manual changeovers
The Production Manager’s perspective captured the compound impact: “Each setup took over 30 minutes. Manual changeovers, paper-based tracking, and lack of real-time visibility were slowing us down. We needed a system that could keep up.” In a facility running dozens of changeovers per shift, 30 minutes per changeover represents hours of lost productive capacity daily — capacity that was already paid for in labour, equipment, and overhead but wasn’t generating output.
The Solution: FactoMES + FactoPlan — Digital Operations and AI Scheduling
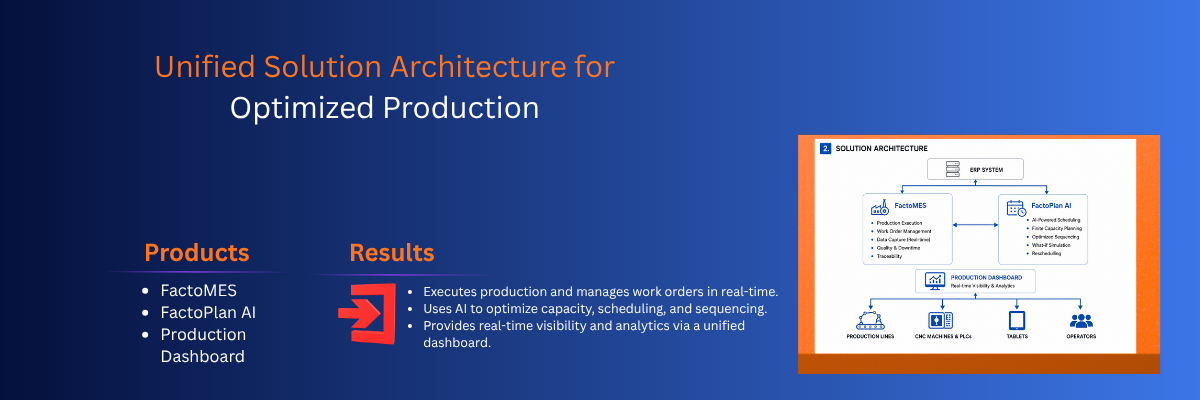
LeanQubit deployed a two-part solution addressing both the production management challenge (FactoMES) and the scheduling challenge (FactoPlan):
Part 1: FactoMES — Shop Floor Digitisation
FactoMES was deployed across all 5 production lines and 100+ stations as the production management and digitisation platform:
ISA-95 compliant data model: A standardised data model for products, orders, recipes, equipment, and traceability — providing the structural foundation that paper-based tracking could never offer.
Tablets and workstations at every station: Every production station received a tablet or workstation terminal connected to FactoMES. Operators interact with the system in real time — confirming operations, entering quality counts, logging downtime reasons, recording deviations — at the moment events occur, not at end of shift.
Integrated quality tracking: Quality inspection counts and defect classifications are entered at the point of occurrence on the shop floor terminal. The quality data flows immediately into FactoMES, is visible to supervisors in real time, and feeds back to ERP for cost and inventory accounting — replacing the delayed, estimated quality data that the paper-based process produced.
Live downtime and deviation capture: Downtime events trigger a recording prompt on the station terminal — operators select a structured reason code from a configured list (not free text), confirm the start time (populated automatically from machine state detection where SCADA integration is available), and record any additional comments. Deviations follow the same structured capture process.
Real-time order progress visibility: Supervisors and planners see the current production position across all 5 lines and 100+ stations on a real-time dashboard — which orders are running, what percentage complete, which stations are idle, what quality holds are open, what downtime events are active. This visibility is available from any terminal in the facility and remotely for management.
The Game-Changer: Automated Setup and Recipe Management
The single highest-impact feature of the FactoMES deployment — and the one that produced the most dramatic measurable result — was automated recipe and setup management.
How it works: FactoMES maintains a central repository of machine recipes — the specific parameter sets (dimensions, speeds, positions, tooling configurations) required to produce each product variant on each machine. When a new production order starts on a machine, FactoMES automatically identifies the correct recipe for that order’s product variant, version, and machine combination, and downloads the parameters to the machine controller.
What changed: The operator’s changeover process went from “read paper routing sheet → manually enter 15-20 parameters → verify → test first piece → adjust if wrong” to “confirm order on the terminal → recipe downloads automatically → verify first piece.” The manual parameter entry step — the 12-15 minute core of the old changeover process — was eliminated entirely.
The error reduction: Because recipes are centrally managed and version-controlled in FactoMES, the risk of an operator entering incorrect parameters is eliminated. Every setup uses the correct, validated recipe for the specific product-machine combination — no possibility of transposing a number, using an outdated specification, or entering parameters intended for a different product.
Part 2: FactoPlan — AI-Powered Finite Capacity Scheduling
FactoPlan replaced the spreadsheet-based scheduling process with an AI-powered finite capacity scheduler specifically designed for high-mix, high-volume manufacturing:
Automated scheduling of 3,500+ order lines: FactoPlan ingests production orders from ERP and generates optimised schedules across 200+ machines in minutes — a process that previously took planners hours of manual spreadsheet sorting.
Constraint-aware optimisation: FactoPlan’s scheduling engine considers: machine availability and capability (which machines can run which operations), labour skill requirements (which operator qualifications are needed for each operation), changeover and setup times (minimising total changeover by sequencing similar products together), resource utilisation targets, and order priorities and delivery commitments.
Intelligent batching: Large orders are automatically broken into optimised batch sizes for improved throughput — balancing the efficiency of larger batches against the flexibility of smaller ones based on downstream station capacity.
Changeover sequence optimisation: FactoPlan sequences orders on each machine to minimise total setup and changeover time — grouping product families that share similar tooling, dimensions, or material specifications to reduce the number of full changeover events per shift.
Dynamic rescheduling: When production reality diverges from the plan — a machine goes down, a quality hold delays an order, a rush order arrives — FactoPlan regenerates the affected portion of the schedule in real time, showing planners the impact on downstream commitments and recommending alternative sequencing.
The FactoMES Dashboard: Visibility That Didn’t Exist Before
The FactoMES deployment included a comprehensive dashboard system providing three levels of operational visibility:
Line-level (supervisor view): All stations on the line — current orders, completion percentages, quality status, active downtime events, shift OEE.
Plant-level (planner/management view): All 5 lines — production schedule adherence, facility OEE, delayed orders, machine utilisation, top downtime reasons.
Implementation
Timeline
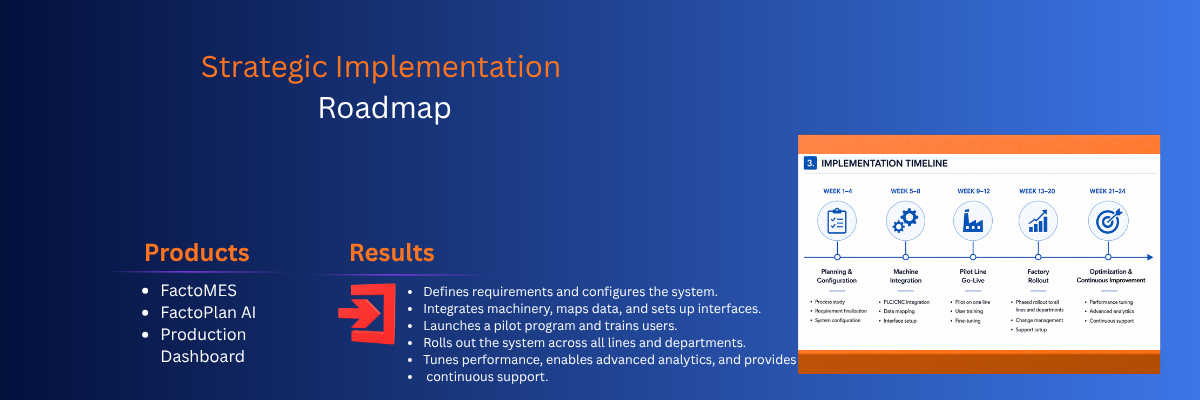
Weeks 1-4: Requirements refinement, FactoMES configuration for the client’s product structure (hundreds of product variants, recipes, routings), and recipe repository population.
Weeks 5-8: Ignition SCADA deployment and machine integration at pilot line (Line 1, 20+ stations). Tablet deployment at stations. Operator training.
Weeks 9-12: Pilot line go-live. Parallel operation (paper + FactoMES) for 2 weeks to validate accuracy, followed by paper process decommission on the pilot line.
Weeks 13-20: Rollout to remaining 4 lines in waves of 1-2 lines per wave. FactoPlan deployment and calibration against production actuals.
Weeks 21-24: Full facility live on FactoMES and FactoPlan. Legacy spreadsheet scheduling decommissioned. Operator feedback loop initiated for system refinement.
Change management: the human side
The transition from paper to digital required careful change management — operators who had worked with paper routing sheets for years needed to trust that the tablet-based system was reliable and that automated recipe downloads would produce correct setups.
The approach that worked: start with the pilot line, let operators experience the 80% setup time reduction first-hand, and then use those operators as advocates during rollout to subsequent lines. The most effective adoption driver wasn’t training — it was operators on Line 1 telling operators on Line 3 that the new system was genuinely faster and easier.
From the production supervisor
“Before MES, it was hard to tell where a job was or why a machine stopped. Now, we get real-time visibility into every station — what’s running, what’s delayed, and what needs attention.” — Production Supervisor, Upholstery Line
Results and Impact
Headline metrics — verified post-deployment
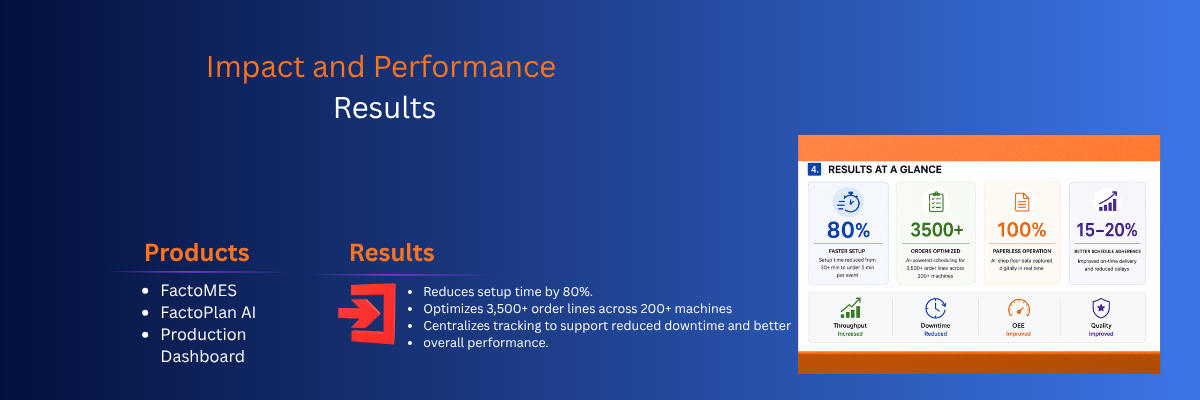
80% reduction in setup and changeover time — from over 30 minutes per event (manual parameter entry) to under 5 minutes (automated recipe download + first piece verification). Across dozens of changeovers per day, this recovered hours of productive capacity daily.
50% reduction in order management cycle time — the administrative time from ERP order release to ERP confirmation was halved. Electronic dispatch, real-time confirmation, and automatic ERP feedback replaced paper distribution, end-of-shift entry, and manual reconciliation.
100% real-time downtime reporting — every downtime event is now captured digitally with structured reason codes, start/end times from machine signals, and operator comments — in real time, not at end of shift. For the first time, the facility has complete, accurate downtime data that enables genuine root-cause Pareto analysis.
3,500+ order lines scheduled in minutes — FactoPlan generates the complete production schedule for 200+ machines across 3,500+ order lines in minutes. The same scheduling exercise previously took planners hours of spreadsheet sorting and was fundamentally less optimised (human sequencing cannot match algorithmic changeover optimisation at this scale).
Quality response time improved dramatically — quality issues identified at the source, when they occur, rather than hours later during end-of-shift data entry. The feedback loop between quality event and management awareness compressed from hours to minutes.
15-20% improvement in schedule adherence — measured as the percentage of planned orders completed on the planned date. Improvement driven by both more accurate initial scheduling (FactoPlan using real capacity data) and faster rescheduling when deviations occur.
Sustained throughput increase across all 5 lines — the combination of reduced changeover time, more efficient scheduling, and faster quality response produced a measurable increase in overall throughput — more units produced from the same equipment, labour, and shift schedule.
Unexpected wins
Operator-driven process improvement: With tablet terminals at every station, operators began using the deviation recording feature not just for errors but for improvement suggestions. Small but meaningful changes emerged — optimising glue drying cycles, adjusting material staging sequences, fine-tuning edge banding temperature profiles — saving 20-30 minutes per shift across certain assembly lines. The MES became a continuous improvement feedback channel, not just a recording system.
Maintenance response acceleration: Real-time downtime recording with structured reason codes enabled the maintenance team to identify recurring equipment issues from data patterns — reducing average time-to-resolution by 40% by responding to developing patterns rather than individual events.
Strategic outcomes
Foundation for continuous improvement and analytics — the digital production record created by FactoMES provides the data foundation for systematic operational improvement. OEE analysis, downtime Pareto, quality trend analysis, and changeover pattern investigation are all possible for the first time — using real data, not estimates.
Ready for AI agents — the FactoMES data model is architecturally ready for MaintIQ (predictive maintenance), ProdIQ (production intelligence), and QualIQ (quality root-cause analysis). The client’s roadmap includes deploying MaintIQ on critical CNC equipment and QualIQ for defect root-cause correlation.
The Plant Operations Director's perspective
“LeanQubit’s platform gave us more than digitalization — it gave us foresight. We now know what’s happening, why it’s happening, and what to do next.” — Plant Operations Director, Furniture Manufacturer
What’s Next: The Client’s AI Roadmap
The client’s forward roadmap with LeanQubit includes four initiatives:
Predictive setup optimisation: Piloting AI-driven recipe validation to pre-check all setup parameters before changeover — aiming to reduce changeover time further, from under 5 minutes to under 2 minutes, by eliminating the first-piece verification step for recipes with high historical reliability.
OEE-driven autonomous scheduling: Future versions of FactoPlan will factor in OEE trends, shift-specific efficiency patterns, and historical bottleneck data to autonomously suggest the most efficient production sequence — reducing planner intervention for routine scheduling decisions.
Connected work instructions: Digital work instructions integrated into each MES station terminal — ensuring operators always follow the most current assembly procedures based on product version and customer specifications. Visual instructions (images, videos) for complex assembly operations.
Cloud-based KPI benchmarking: Aggregating FactoMES data from this facility (and future facilities) into a cloud dashboard for cross-site performance comparison — enabling corporate-level operations oversight and best-practice identification across the manufacturing network.
Frequently Asked Questions
The recipe repository was populated in three phases: (1) automated extraction of existing CNC programmes and machine parameter sets from machine controllers (capturing what was already programmed); (2) systematic validation of extracted recipes against engineering specifications by the client’s production engineering team; (3) gap-fill for product variants that existed in ERP but had never been formally documented as machine recipes. Phase 3 was the most time-intensive — it required production engineers to create validated recipes for variants that had previously been set up from memory or informal notes. This work took approximately 4 weeks for the full product range.
The operator adoption curve varied. Most operators were comfortable with the tablet interface within 1-2 shifts — the interface was designed for shop-floor use (large touch targets, simple workflows, visual confirmations) rather than as an office application. For operators who needed additional time, buddy-pairing with experienced operators from the pilot line was the most effective support mechanism. The key adoption driver was the visible benefit: operators could see that automated recipe downloads made their changeovers faster and eliminated the parameter entry mistakes that had been a source of frustration.
Yes — this is one of FactoPlan’s core design capabilities. When a rush order arrives, an existing order is modified, or a customer changes priorities, FactoPlan recalculates the affected portion of the schedule and presents the impact analysis (which orders are pushed, by how much, what delivery commitments are affected) to the planner. The planner approves the revised schedule, and all station terminals update automatically. This cycle — from order change to updated floor schedule — takes minutes, versus the hours it took with spreadsheet-based replanning.
The setup time reduction alone (from 30+ minutes to under 5 minutes per changeover, across dozens of daily changeovers) recovered production capacity equivalent to the deployment cost within the first 6-9 months. The additional benefits — reduced order management overhead, quality improvement from real-time feedback, scheduling efficiency from FactoPlan — accelerated the payback further. Full ROI was achieved within the first year of deployment.