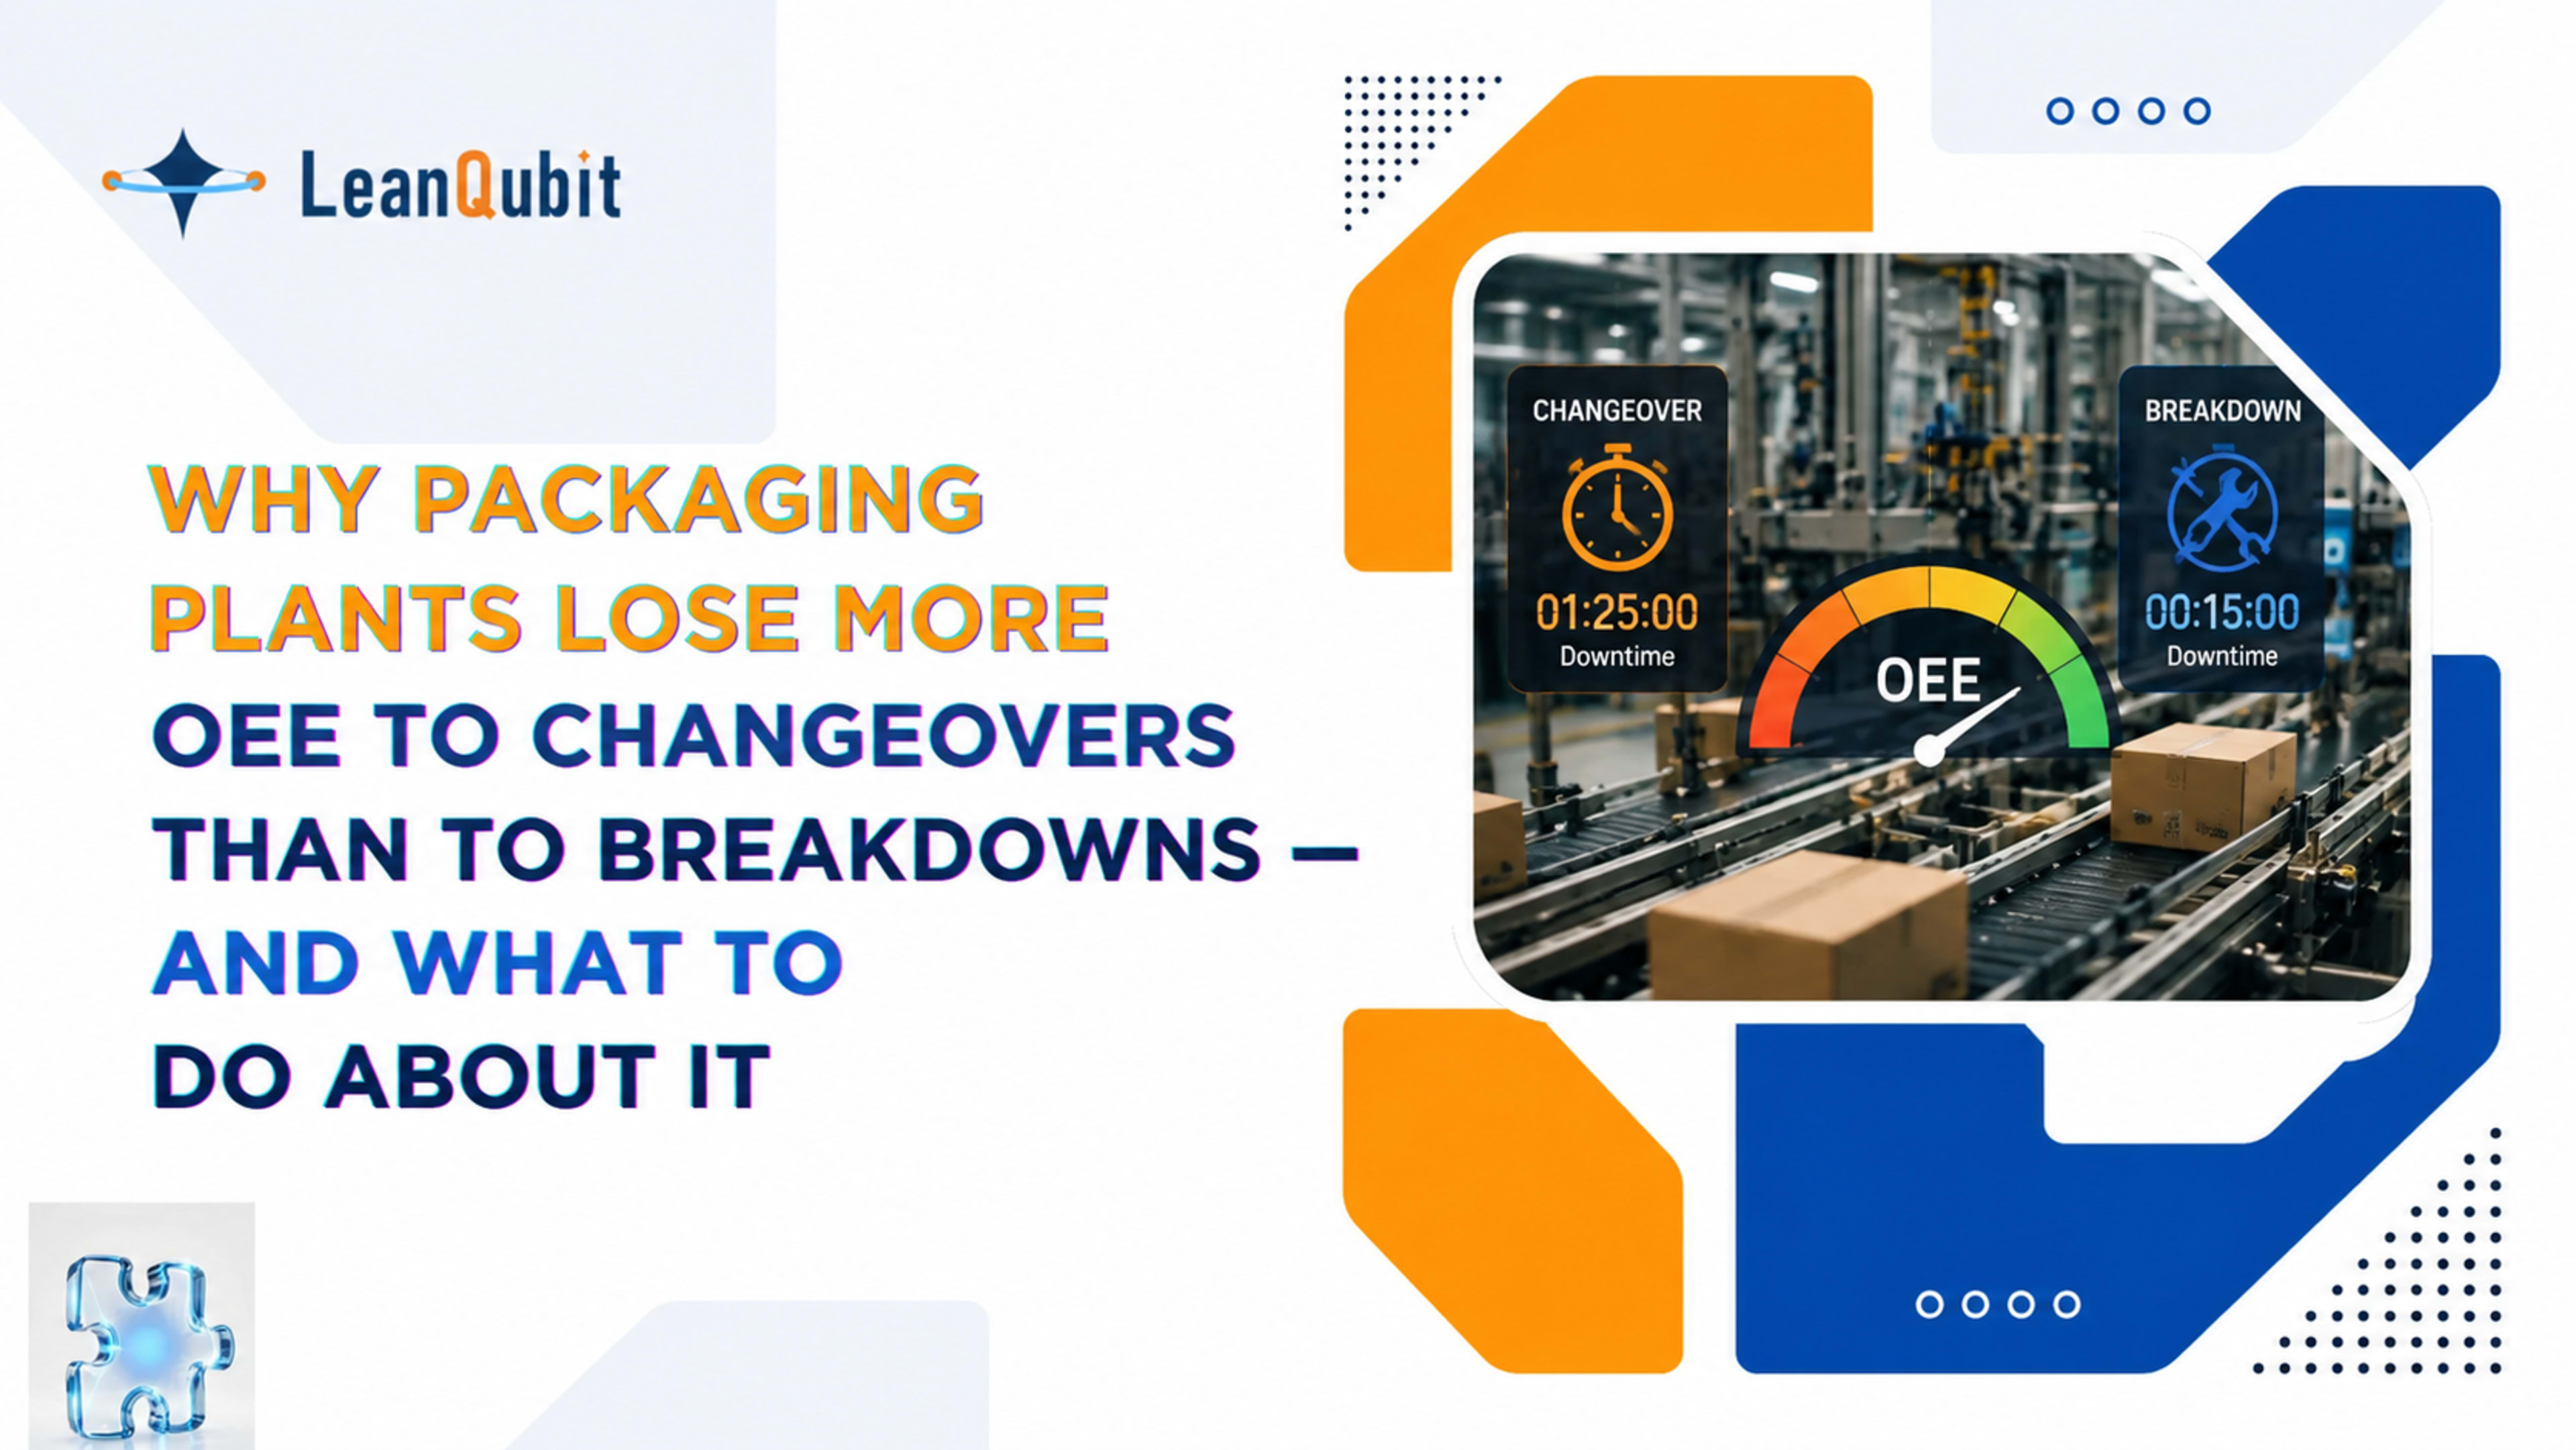
- In high-mix packaging operations, changeover-related availability loss routinely outweighs breakdown-related availability loss — yet most plants track breakdowns carefully and changeovers loosely.
- Changeover sequencing is an optimization problem, not a scheduling preference — the order in which SKUs are run across a line determines total changeover minutes consumed per shift, and AI-based scheduling can reduce that figure significantly without adding capacity.
- Real-time production visibility and digital work instructions change how changeovers are executed on the floor — not just how they are planned — by eliminating the information gaps that cause changeovers to run longer than they should.
- Label and print verification errors are among the most costly quality failures in packaging manufacturing because they are often invisible until a customer or regulator catches them; AI visual inspection closes this gap at line speed.
- The data needed to drive changeover improvement already exists in most packaging plants — the problem is that it lives in disconnected systems that nobody has unified into a decision-support layer.
The OEE problem that packaging plants are misdiagnosing
Ask a packaging plant manager where their OEE goes, and the answer is almost always the same: equipment failures, unplanned stoppages, quality defects. These are real losses, and they are visible. A conveyor stops. A sealer jams. A filler runs out of spec. These events get logged, investigated, and — with enough effort — reduced.
Changeovers are different. They happen dozens of times a week, every week. They are planned events. And because they are planned, most plants don’t treat them with the same analytical rigor as they treat breakdowns. The changeover was scheduled for 45 minutes. It ran for 65. The extra 20 minutes disappear into the shift log as “changeover,” and nobody pursues what actually consumed them.
In a high-mix packaging operation — where a single line might run 30 or 40 different SKUs across formats, substrates, label configurations, and fill weights — the accumulated weight of poorly managed changeovers frequently exceeds the accumulated weight of equipment downtime. The plant is losing more OEE to events it considers routine than to events it considers problems.
In high-mix packaging lines, changeover losses can account for 15–25% of available production time when accumulated across all format changes, label runs, and cleaning sequences in a typical week. Most plants track this figure at the shift level but rarely aggregate it into an OEE loss analysis that gets the same management attention as breakdown downtime.
Why changeover management is harder in packaging than in most other industries
Packaging manufacturing has a complexity profile that most other industries don’t share. A pharmaceutical manufacturer running a handful of products across validated processes has a very different changeover problem from a contract packaging operation running 150 active SKUs across flexible format lines. The sheer number of product permutations — size, format, substrate, label variant, closure type — means that no two production weeks look the same.
Three features of packaging manufacturing make changeover management particularly challenging:
First, The sequencing dependency, In packaging, the order in which you run SKUs across a line determines how much total changeover time you consume. Running a 500ml bottle before a 250ml bottle is a different changeover than the reverse — because tooling adjustments, sensor resets, and format part changes vary by transition, not just by product. A planner who sequences jobs based on customer priority alone, rather than changeover compatibility, will consistently burn more changeover time than one who optimizes the sequence. With 30 or more active SKUs, the combinatorial complexity of finding the optimal sequence exceeds what any person can reliably calculate manually.
Second, the execution gap, Even when a changeover is well-planned, the time it actually takes on the floor often diverges from the planned time — because operator instructions are inconsistent, tooling locations vary, and the tribal knowledge of which tasks to do in which order lives in the heads of the most experienced operators rather than in a standardized, visible format. When that knowledge walks out the door at the end of a shift, the next operator starts from a less efficient baseline.
Third, the quality exposure at each changeover, Every format or SKU transition creates a window of elevated quality risk. Label configurations change. Fill targets shift. Seal parameters are adjusted. The first units off the line after a changeover are statistically the most likely to carry a quality defect — a print error on the label, a fill weight that’s outside tolerance, a cap that isn’t torqued correctly. In packaging, quality failures at changeover are particularly consequential because many of them are invisible until they reach a customer.
What connected intelligence actually changes for packaging operations
The phrase “connected intelligence” gets used broadly enough to mean almost anything. In the context of a packaging plant’s changeover problem, it means something specific: the ability to take data that already exists across production systems, unify it, and use it to support better decisions at three distinct points in the changeover process — before, during, and after.
Before the changeover: intelligent scheduling and sequencing
FactoPlan is LeanQubit’s production scheduling and planning tool, and one of its most direct applications in packaging is changeover sequence optimization. Rather than scheduling production orders based solely on due dates or customer priority, FactoPlan uses finite capacity planning and constraint-based algorithms to generate sequences that minimize total changeover time across the week — while still meeting delivery commitments.
The practical effect is that a planner stops manually puzzling over which order to run 30 SKUs and instead works from a system-generated sequence that has already accounted for tooling compatibility, format transition costs, and available production windows. The planner’s role shifts from calculating the sequence to reviewing and confirming it — which is a better use of a human’s time and expertise.
Beyond sequencing, FactoPlan surfaces scheduling alerts in advance of each changeover — flagging material availability gaps, tooling conflicts, or maintenance windows that would otherwise only become visible when the line is about to run.
One underused capability in changeover planning is the scenario simulation. Before committing to a production schedule, running two or three alternative sequences through a simulation reveals how much changeover time each one consumes. The difference between a well-sequenced week and a poorly sequenced week on a high-mix packaging line can be eight to twelve hours of recovered capacity — without any capital investment.
During the changeover: real-time execution visibility and digital work instructions
Planning a better changeover and executing a better changeover are two different problems. The execution gap is where most of the unplanned time in a changeover actually occurs — not in the steps that go wrong, but in the transitions between steps: the five minutes spent finding the right tooling, the three minutes spent re-reading an instruction sheet that wasn’t updated after the last product revision, the ten minutes spent waiting for a first-article approval that could have been completed earlier.
FactoMES, LeanQubit’s real-time Manufacturing Execution System, addresses this through digital workflows and work instructions delivered to operators at the point of execution. Rather than relying on a paper changeover sheet or a shared drive document, operators step through a digitized changeover sequence on a screen at the workstation — with each step confirmed before the next one appears. Timing is captured automatically at each step, not just at the beginning and end of the changeover.
This step-level timing data is the key diagnostic input that most packaging plants don’t have. If a changeover consistently runs long, the data reveals which specific step is consuming the extra time — not just that the overall changeover was late. That’s the difference between a data set that tells you there’s a problem and a data set that tells you where to fix it.
FactoMES also provides real-time machine monitoring during changeover, surfacing line state data that lets a floor supervisor see, at a glance, which lines are in changeover, which have completed setup, and which are running behind against the planned changeover window — without having to walk the floor.
After the changeover: quality verification at line speed
The highest-risk moment in a packaging line’s production cycle is the first several minutes after a changeover completes. Label configurations have changed. Sensors have been reset. Filler parameters have been adjusted. The probability of a defect on the first units off the line is substantially higher than mid-run probability — and in packaging, the consequences of a label error, an incorrect barcode, or a fill weight deviation reaching a customer are significant.
FactoVision — LeanQubit’s AI-driven visual quality inspection platform — is particularly well-suited to this post-changeover quality verification challenge. FactoVision uses AI image analysis to automatically inspect packaging units in real time at line speed, checking label content, print quality, size and appearance conformance, and SOP compliance against the specification for the current SKU.
The practical value in packaging is that FactoVision can detect a label error, a missing element, or a print defect on the first unit off the line — before the line builds a pallet of non-conforming product. The alternative — manual first-article inspection — is slower, less consistent, and dependent on an operator’s attention at the exact moment when they are also completing the final steps of a changeover.
FactoVision also connects to FactoMES to log quality events against the specific production order and changeover record, creating a traceability chain that links every defect to the process conditions active at the time it occurred.
The data challenge: why packaging plants have the data they need and can’t use it
One of the consistent findings when packaging manufacturers begin a digitization assessment is that the plant already generates most of the data needed to drive meaningful improvement. Production counts, downtime events, quality results, and changeover records exist — they are just fragmented across systems that don’t communicate with each other. Shift logs live in spreadsheets. Quality records live in a standalone QMS. Machine data lives in the SCADA historian. Production orders live in the ERP. Nobody has unified these streams into a single analytical layer.
This data fragmentation is the reason that changeover improvement in packaging tends to plateau after the initial lean initiatives. SMED workshops identify the obvious wastes. Standard work sheets codify the process. But the ongoing analytics that would reveal whether the improvement is holding — or identify where new losses are emerging — require a unified data foundation that most plants don’t have.
FactoLake, LeanQubit’s industrial data platform, provides this unified foundation. Built on Apache Iceberg architecture, FactoLake consolidates data from machine historians, SCADA, MES, and ERP into a single source of truth — making it possible to run analytics that cross system boundaries. A changeover performance analysis that correlates the sequence of SKUs run, the operator executing the changeover, the time of day, and the resulting quality rate at first articles is only possible when those data streams are unified. FactoLake makes that kind of analysis accessible without a custom data engineering project for each question.
If I wanted to know which SKU-to-SKU transitions on Line 4 consistently produce the longest changeovers, and which operators execute those transitions fastest — could I get that answer today, without building a custom report? If the answer is no, the plant is making changeover improvement decisions on incomplete information.
Where to start: a practical entry point for packaging manufacturers
The full picture — optimized scheduling, real-time execution visibility, AI quality inspection, unified data — can look like a transformation program that’s years away. It doesn’t have to be. The realistic entry point for most packaging manufacturers is one of three places, depending on where the pain is greatest.
If the pain is in scheduling and sequence planning — the feeling that the planner’s decisions are costing capacity without a clear way to quantify how much — FactoPlan’s scenario simulation and constraint-based scheduling can be implemented as a standalone tool. It connects to the existing ERP for order data and generates optimized sequences without requiring a full MES implementation first.
If the pain is in changeover execution — changeovers that consistently run longer than planned, with no reliable data on where the time goes — FactoMES digital workflows and real-time machine monitoring can be scoped to the specific lines where the problem is most acute. This doesn’t require deploying MES across the entire plant on day one.
If the pain is in post-changeover quality — label errors, fill weight deviations, or print defects that aren’t caught until they reach a customer — FactoVision’s AI visual inspection can be deployed on the highest-risk lines as a targeted quality intervention, integrated with the existing production tracking system.
In each case, the approach follows the same principle that applies across all LeanQubit deployments: start with the domain where the pain is clearest, validate the value with real production data, and expand from there.
Conclusion
The packaging line that runs the most SKUs doesn’t have to lose the most OEE
High-mix packaging manufacturing isn’t going to become simpler. Retailer requirements, sustainability mandates, and consumer demand for product variety are all pushing packaging manufacturers toward more SKUs, more format flexibility, and faster response to new product introductions. The operational pressure that creates is real.
The answer isn’t to resist that complexity — it’s to build the connected intelligence layer that makes complexity manageable. Optimized scheduling that turns changeover sequencing from a manual puzzle into a system-generated recommendation. Real-time execution tracking that makes changeover performance visible step by step, not just in aggregate. AI visual inspection that catches the quality failures that changeovers create before they leave the line. And a unified data foundation that makes all of these improvements compounding rather than isolated.
The data to drive these improvements already exists in most packaging plants. What’s missing is the connected layer that turns fragmented production data into decision-ready intelligence. That’s the gap LeanQubit is built to close.
Frequently Asked Questions
SMED reduces the time required to execute a single changeover — and it works. But even with SMED-optimized execution, the sequence in which changeovers occur across a production week determines the total changeover minutes consumed. A plant with excellent individual changeover execution but poor sequencing can still lose more OEE to changeovers than a plant with average individual changeover times that sequences SKUs intelligently. The two improvements are complementary, not substitutes: SMED improves individual execution; scheduling optimization improves the aggregate impact of all changeovers across the week.
FactoVision’s AI vision capabilities are applicable to a range of packaging formats. The specific inspection use cases — label verification, print quality, size and appearance conformance — apply across rigid (bottles, cans, trays) and flexible (pouches, bags, wraps) formats. Implementation is configured to the specific format, substrate, and inspection criteria relevant to the production environment. For packaging lines running multiple format types, FactoVision’s model can be trained to switch inspection parameters alongside the SKU changeover.
FactoPlan connects to ERP systems via API or direct database integration — the specific connector depends on the ERP in use. LeanQubit’s implementation team scopes the integration as part of the pre-deployment assessment. Production orders, due dates, and inventory data from the ERP serve as the scheduling inputs; FactoPlan generates the optimized sequence and, where configured, pushes confirmed schedules back to the ERP for order status updates.
FactoMES can be deployed as a changeover execution and tracking layer alongside existing production tracking systems, rather than replacing them. The digital workflow captures step-level timing during changeover execution; that data feeds FactoIQ analytics and FactoLake for long-term analysis. Whether FactoMES and an existing system need to be integrated or run in parallel depends on the specific systems involved and is assessed during implementation scoping.
LeanQubit’s IoT integration connects machines, sensors, PLCs, and systems using standard industrial protocols. Packaging equipment from major machine builders typically communicates via OPC-UA, Modbus, or proprietary protocols — all of which LeanQubit’s OT–IT integration layer can handle. The integration connects packaging line equipment into a unified data stream that feeds FactoMES, FactoIQ, and FactoLake without requiring custom middleware for each machine type.
A well-scoped FactoMES implementation for a single packaging facility typically runs 12–20 weeks from kick-off to go-live, depending on line complexity, the number of SKUs, and the degree of integration required with existing ERP and quality systems. Implementations scoped to a specific subset of lines — rather than full-plant deployment — can be completed in a shorter window and provide a validated value case before the broader rollout.
Running a high-mix packaging operation and want to understand where your changeover losses are actually coming from? Book a free scoping call with LeanQubit’s engineers — we’ll run an OEE gap analysis on your specific lines and identify which intervention would have the greatest impact.