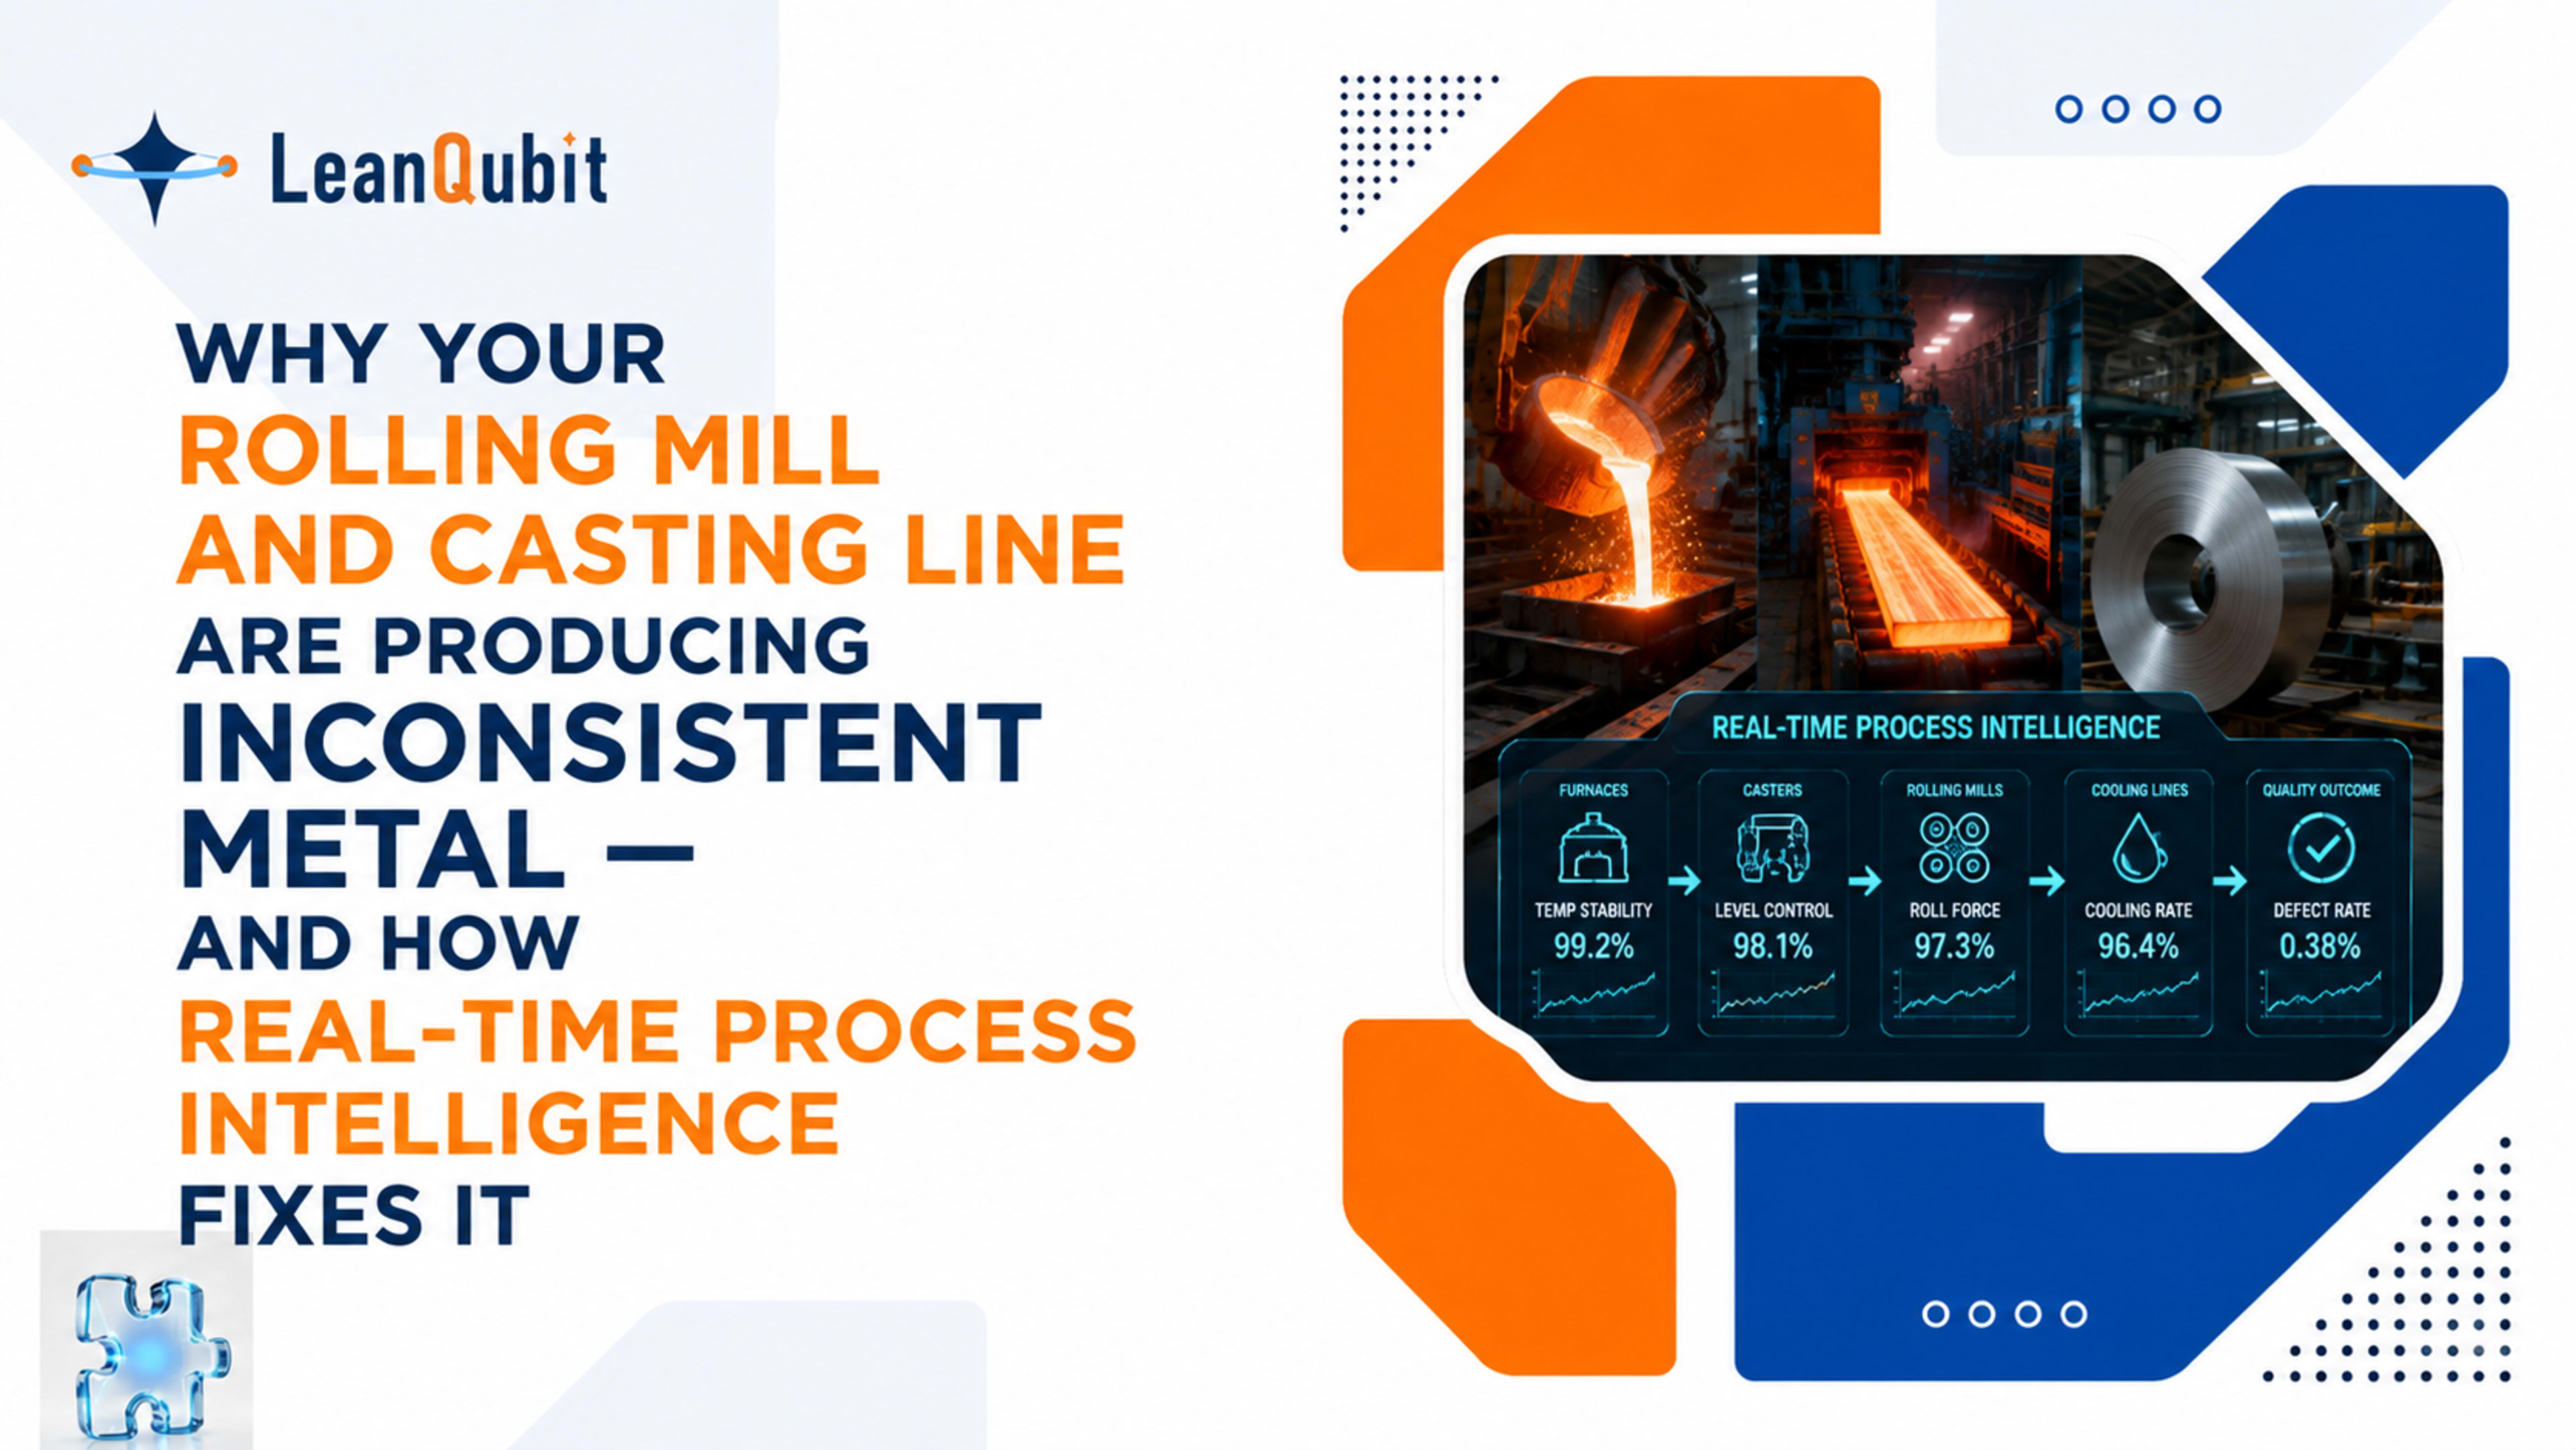
- Process variability in metal manufacturing is rarely caused by one machine or one parameter — it is almost always a multi-point deviation chain that spans furnace, casting, rolling, and cooling stages, and is invisible to any single monitoring system operating in isolation.
- Real-time OT–IT integration — connecting PLCs, sensors, and process historians to a unified data layer — is the prerequisite for catching variability patterns before they propagate into scrap, rework, or off-spec coil and billet.
- AI-driven process intelligence in metal plants goes beyond dashboard visibility: it correlates temperature drift, speed variation, roll gap deviation, and cooling rate simultaneously, identifying which parameter combination explains a quality outcome — not just which individual metric was out of range.
- Predictive early-warning systems in rolling mills and casting lines don't predict machine failures in the traditional sense — they predict process-state drift: the slow migration of a combination of parameters away from the proven process window that reliably produces on-spec material.
- The highest-value starting point for most aluminium and steel manufacturers is not a full MES rollout — it is connecting existing process data (PLC, SCADA, historian) to an AI analytics layer that can immediately start finding the correlations operators have always suspected but never been able to prove.
The problem isn’t that your process data doesn’t exist. It’s that nobody is reading all of it at once.
Walk into most aluminium extrusion plants or steel flat-roll facilities today and you’ll find data. Plenty of it. Furnace temperature logs. Rolling mill speed records. Coolant flow readings. Coil thickness measurements. Billet chemistry traces. The plant historian has been collecting most of this for years.
But ask the quality team why last Tuesday’s coil run had a surface finish issue, and you’ll see the real problem. They’ll pull the furnace log. The rolling team will pull the mill speed record. Maintenance will check whether the work rolls were recently changed. Nobody will look at all of it together, at the same time, in relation to each other.
This is the core operational challenge for aluminium and steel manufacturers at every scale: the data that explains process variability exists, but it lives in separate systems, is reviewed by separate teams, and is analysed reactively — after the scrap, after the rework, after the customer complaint.
The shift that’s happening in progressive metal plants right now is not about collecting more data. It’s about finally connecting what already exists — and putting intelligence on top of it that can see the whole picture simultaneously.
In flat-rolled aluminium and steel production, surface quality and mechanical property deviations typically result from a combination of three to five co-occurring parameter drifts — not a single out-of-spec reading. A system that monitors parameters in isolation will miss most of the patterns that matter.
What ‘process variability’ actually looks like on a metal production floor
The phrase ‘process variability’ covers a lot of ground in metal manufacturing. In practice, it shows up in a handful of ways that every plant manager and metallurgist will recognize immediately.
In aluminium casting and extrusion, it might be billet temperature non-uniformity coming out of the soaking pit — close enough to spec that the operator accepts it, but consistently on the edge of the window that produces good die fill and surface finish. By the time the extruded profile shows a surface defect downstream, the original temperature trace is gone from anyone’s active attention.
In steel flat rolling, it might be a work roll surface condition that’s drifting across a campaign — gradual enough that no individual coil triggers a quality stop, but consistent enough that a pattern is accumulating in the roll force and strip thickness data that will eventually produce an off-spec coil. The pattern is in the data. Nobody is watching it continuously.
In continuous casting — whether aluminium or steel — variability often comes from cooling rate inconsistency: mould-level fluctuations, secondary cooling water flow changes, or subtle oscillation mark depth variation that correlates with downstream crack susceptibility in a way that isn’t obvious until the downstream defect appears.
What these scenarios share is a common structure: the root cause is visible in process data that already exists, the deviation develops over a time window that is too long for real-time operator attention and too short for end-of-shift reporting to catch, and the consequence arrives downstream — in a different process step, often a different team’s responsibility.
Why OT–IT integration is the foundation, not the destination
When metal manufacturers talk about digital transformation, the conversation often jumps quickly to AI, dashboards, and predictive analytics — and skips past the step that actually makes those things work: getting your operational technology (OT) and information technology (IT) ecosystems talking to each other reliably.
In most aluminium and steel plants, the OT side — PLCs, SCADA systems, process historians, sensor networks across furnaces, mills, and cooling lines — generates a continuous stream of high-frequency process data. The IT side — ERP systems, quality management systems, production order records — holds the business context: what grade was being produced, what order it was for, what the customer specification required.
Without a unified layer connecting these two sides, the high-frequency process signals and the business context live in separate silos. A quality defect gets investigated with the production order record on one screen and the process historian on another, manually correlated by a metallurgist who has to guess which time window to look at.
OT–IT integration in metal plants means connecting these sources into a single unified data context — so that when a surface inspection system flags a strip defect at 14:32, the system can automatically look at what the furnace was doing between 13:45 and 14:15, what the roll forces were on stands 3 and 4 in that window, and what the coolant flow was across the run-out table. All of it together, automatically, without anyone having to manually assemble the picture.
This is the foundation. The AI and analytics that give you forward-looking capability sit on top of this connected data layer — they don’t work without it.
The Ignition SCADA platform — which LeanQubit implements as a certified integrator — is a common starting point for this OT–IT convergence in metal plants. It connects PLCs, SCADA, historian, and edge data sources into a unified data pipeline that can feed both real-time operator interfaces and the analytical systems above them.
What real-time process intelligence actually monitors in rolling mills and casting lines
Once the OT–IT data layer is in place, the operational intelligence layer that runs on top of it can start doing something qualitatively different from what a traditional SCADA dashboard or historian report provides.
In a rolling mill context — whether hot or cold rolling, aluminium or steel — the critical monitoring isn’t just individual parameter tracking. It’s simultaneous, correlated monitoring of the combinations of parameters that define a stable, on-spec process window. Roll force and speed profiles across tandem mill stands. Entry temperature and exit gauge at each stand. Strip tension between stands. Coolant application rates relative to strip speed and width.
The question real-time process intelligence asks is not ‘is stand 3 roll force within tolerance?’ — it’s ‘is the current combination of roll force, entry temperature, strip speed, and tension pattern consistent with the process windows that historically produced good flatness and surface quality for this alloy and gauge?’ Those are very different questions, and only the second one can catch a developing problem before it produces a defective coil.
For casting lines
In continuous casting — slab casting, bloom casting, or aluminium DC casting — real-time process intelligence tracks the parameter combinations that influence solidification quality: mould-level stability and oscillation characteristics, secondary cooling zone water flows and their relationship to casting speed, tundish temperature and its influence on inclusion formation risk, and strand temperature profiles that predict internal quality.
The value is not just monitoring — it’s the ability to correlate what the process was doing during a casting event with what the downstream inspection or mechanical testing subsequently found. Over time, this builds a plant-specific model of which process state combinations reliably produce which quality outcomes for each grade and format.
For furnace and thermal processing
In soaking pits, annealing furnaces, homogenising furnaces, and heat treatment lines, the monitoring priority is temperature uniformity and trajectory — not just the setpoint, but how close the actual thermal profile across a charge came to the intended time-temperature curve. Billet-to-billet variation in soak time. Zone-to-zone temperature differentials in batch furnaces. Atmosphere control consistency in annealing lines.
In large aluminium and steel operations, this is where significant hidden losses accumulate — furnace cycles that are longer than necessary because operators err on the side of caution, charges that are accepted when they’re marginally under-soaked because the rejection criteria are fuzzy without real-time thermal data.
The difference between predictive maintenance and predictive process — and why metal manufacturers need both
Most discussions of AI in manufacturing focus on predictive maintenance: detecting early signs of equipment failure before a breakdown occurs. In metal manufacturing — where unplanned downtime on a hot strip mill or a DC casting line can cost hundreds of thousands of dollars per hour — predictive maintenance is absolutely valuable.
But metal manufacturers have a second, equally important AI application that’s less commonly discussed: predictive process intelligence, which is different from predictive maintenance in a significant way.
Predictive maintenance asks: ‘Is this piece of equipment about to fail?’ It watches vibration signatures, bearing temperatures, motor current draw, hydraulic pressure trends — the condition signals that indicate mechanical deterioration.
Predictive process intelligence asks: ‘Is this process drifting toward a state that will produce off-spec or inconsistent material?’ It watches the combination of process parameters — temperature, speed, force, flow, chemistry — against the known process windows that produce good-quality output for each product grade.
In a tandem cold mill running aerospace-grade aluminium sheet, both matter — and they’re different systems watching different things. A roll bearing showing early fatigue will eventually cause an unplanned stop. But a slow drift in roll gap profile and work roll thermal crown, within the mechanical limits where no alarm fires, will produce a flatness issue that doesn’t appear until the coil is at the customer’s press.
The most sophisticated metal plants are beginning to run both simultaneously: MaintIQ-class agents watching equipment health signals, and process intelligence layers watching parameter-combination drift against grade-specific quality models.
When evaluating AI solutions for a metal plant, ask the vendor to distinguish clearly between equipment condition monitoring (predictive maintenance) and process-state monitoring (predictive quality). Both are valuable — but they require different data inputs, different model types, and different integration points. A solution that conflates them is likely underdeveloped in one or both.
The tribal knowledge problem in metal manufacturing: why process expertise is at risk
One of the most acute, and least discussed, operational challenges in aluminium and steel plants is the systematic loss of process expertise as experienced metallurgists, mill operators, and furnace crews retire.
The knowledge that experienced operators carry isn’t primarily in their ability to read a gauge or follow a procedure. It’s in their ability to recognize — often from a combination of visual, auditory, and instrumentation cues that they’ve learned to read simultaneously — that a process is drifting before any individual alarm fires. ‘The way stand 4 sounds when the roll crown isn’t right.’ ‘The colour at the furnace door that tells you the charge isn’t ready yet.’ ‘The oscillation pattern that precedes a breakout on the caster.’
This knowledge has never been systematically captured, and it’s walking out the door.
Connected process intelligence systems — ones that record what the full set of parameters was doing across every heat, every coil, every cast, and what the quality outcome was — begin to create a structured record of the conditions that experienced operators recognized as good or bad. Over time, this becomes a plantspecific process model that encodes what the best operators knew, in a form that can be made available to every operator, every shift.
It doesn’t replace the expertise. It preserves enough of it to stop the loss from being total.
Where to start: the realistic first step for aluminium and steel manufacturers
The operational picture above can make the scale of the transformation seem daunting. Plants with decades of legacy equipment, multiple data silos, and limited digital infrastructure sometimes conclude that the starting point is too far away to be practical.
It isn’t. The practical entry point for most aluminium and steel manufacturers is not a full digital transformation programme. It’s a much more targeted first step.
The highest-value starting point is almost always connecting the process historian data that already exists to an analytics layer that can start finding correlations. Most plants have more historical process data than they realize — in SCADA historians, in standalone PLC log files, in downloaded CSV exports from quality instruments. Getting that data into a unified, queryable layer is the first move.
From there, the first analytical question is typically: for our five most common product grades, what combination of process parameters best predicts the quality outcome we most care about? Surface quality, mechanical properties, dimensional accuracy — pick the one that costs the most in rework and customer returns. Run the historical data. Find the pattern.
That first pattern — the one that finally explains something the quality team has always suspected but never been able to prove — is what builds organizational belief in the value of the connected approach. It’s almost never a single parameter. It’s always a combination.
From that starting point, the path to real-time monitoring, AI-driven process alerts, and closed-loop quality feedback is a progression — not a leap.
Conclusion
Aluminium and steel manufacturers have never had a shortage of process data. What they’ve lacked is the connected infrastructure to read that data as a whole — to see the multi-point parameter combinations that explain quality outcomes rather than the individual readings that almost always look acceptable in isolation.
The shift toward real-time process intelligence in metal manufacturing isn’t a technology trend. It’s a practical response to the economics of the industry: tight tolerances, demanding customers, margin pressure from yield losses and rework, and a generation of experienced process knowledge that is retiring faster than it can be replaced.
The plants that move first to connect their OT and IT data layers — to give their quality and process teams a unified view of what the process is actually doing, in real time, correlated across stages — will be the ones that turn process consistency from an aspiration into a measurable operational capability.
The starting point is not as far away as it looks. The data is almost certainly already there.
Frequently Asked Questions
Process variability in metal manufacturing refers to the unintended inconsistency in process conditions — temperature, speed, pressure, chemistry, cooling rate — that results in variation in the quality and properties of the finished product. It’s difficult to control because the root cause is almost always a combination of parameters drifting simultaneously, across multiple stages of production, in a way that no single monitoring system or single operator is watching all at once. A furnace temperature that’s slightly lower than optimal, combined with a mill speed at the high end of the window and a coolant flow that’s slightly reduced, might produce a strip property that’s within acceptance — or might not. Any one of those individually would be fine. The combination is what matters, and the combination is what traditional monitoring systems don’t watch.
OT–IT integration connects the operational technology side of the plant — PLCs, SCADA, sensors, process historians — with the information technology side — ERP, quality management systems, production order records — into a single unified data context. In a rolling mill or casting plant, this means that when a quality issue appears, the system can automatically correlate the product record (grade, order, specification) with what the process was doing at every relevant stage, without anyone having to manually assemble data from multiple systems. Over time, this connected data layer enables AI-driven analytics to find the patterns that explain quality outcomes — patterns that would be invisible to any system looking at only one side of the picture.
Predictive maintenance focuses on equipment condition — detecting early signs of mechanical deterioration (bearing wear, hydraulic pressure loss, motor current drift) that indicate an impending equipment failure. Predictive process intelligence focuses on process state — monitoring whether the current combination of parameters (temperature, speed, force, chemistry, cooling rate) is consistent with the process window that reliably produces on-spec material for the grade being produced. Both are valuable in metal plants. Predictive maintenance prevents unplanned downtime. Predictive process intelligence prevents quality losses and rework — which, in metal production, are often a larger cost than equipment downtime. The two require different data inputs, different model types, and different integration points.
Experienced operators and metallurgists in metal plants carry process knowledge that has never been formally captured — the ability to recognize, from a combination of signals, that a process is drifting before any individual alarm fires. Connected data systems that record the full set of process parameters against every quality outcome begin to create a structured record of what conditions experienced operators recognized as good or bad. Over time, this builds a plant-specific process model that encodes the conditions associated with good outcomes — making that knowledge accessible to every operator on every shift, rather than locked in the memory of a handful of people approaching retirement.
Yes. The approach LeanQubit takes with FactoLake — an industrial data lake built on scalable architecture — is specifically designed to ingest data from existing SCADA systems, PLC historians, and process databases without requiring those systems to be replaced. Data from Ignition SCADA installations, standalone PLC log files, and quality instrument exports can all be unified into a single queryable layer that feeds AI analytics. The entry point is connecting what exists, not replacing it.
The highest-value starting point is usually the process stage where quality variation is most costly and least well understood — which is different for every plant. For most aluminium rolling operations, that’s typically the hot mill entry temperature and mill parameter combination for the grades with the highest scrap rate. For steel casting operations, it’s often the secondary cooling zone and its relationship to internal quality in the grades where downstream cracking is the main issue. The practical approach is to identify the three to five quality problems that cost the most in rework, customer returns, or yield loss, and work backward to which process stages and parameter combinations most likely explain them. That determines where to connect first.
If your rolling mill or casting line is producing variability that your team suspects is pattern-driven but has never been able to prove, a scoping conversation with LeanQubit’s engineers is the practical next step.
We’ll look at what data already exists in your plant, identify where the highest-value connection points are, and show you what the first analytical question should be.
Book a free scoping call at leanqubit.ai/contact